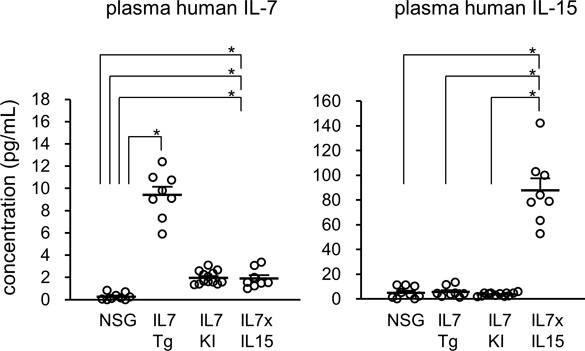
Figure S2. Concentration of human IL-7 and human IL-15 in plasma.

Plasma concentration of hIL-7 (left panel) and hIL-15 (right panel) of NSG mice (n = 9), hIL-7 transgenic mice (IL7Tg: n = 8), hIL-7 knockin mice (IL7KI: n = 13), and hIL-7 xhIL-15 double knockin NSG mice (IL7xIL15: n = 8) are shown. Error bars represent mean ± SEM (*P < 0.001, by two-tailed t test).
