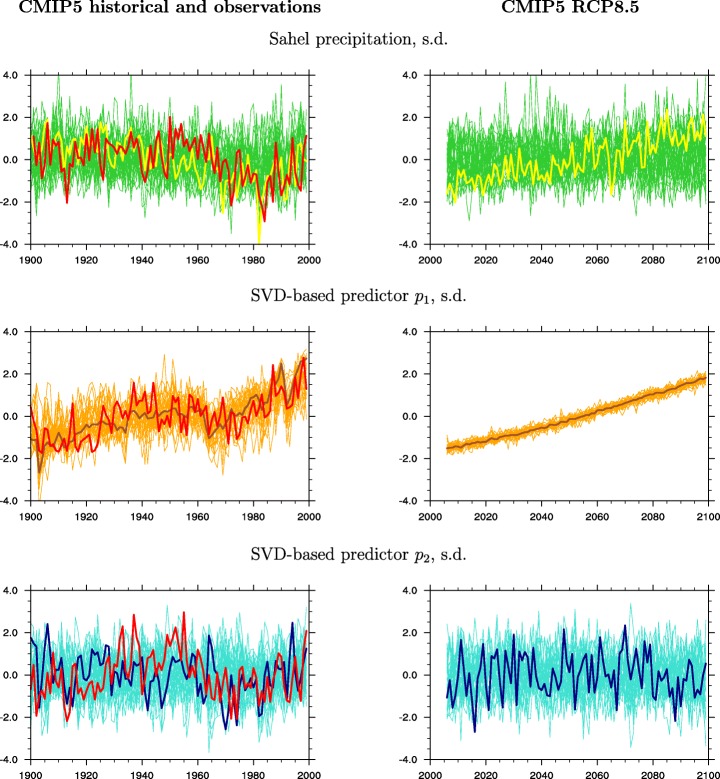
Fig. 1.
Time series of standardized Sahel rainfall (top) and time series of the dominant and trailing SVD modes of the predictors’ space p1 (middle) and p2 (bottom) for the single-model ensemble means of 29 CMIP5 models (thin green, turquoise, and orange lines) and for the multi-model ensemble mean (thick yellow, brown, and blue lines), from the historical simulations (1900–1999) in the left panels, and from the RCP8.5 simulations (2006–2099) in the right panels. The red lines represent observations

