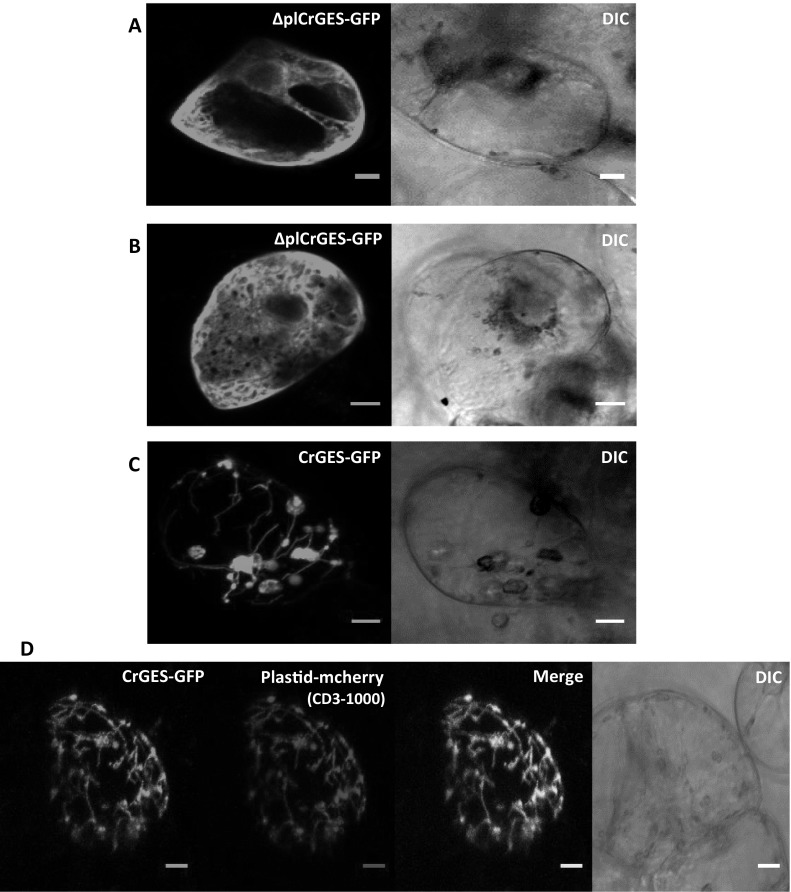
Fig. 2.

Subcellular localization of ΔplCrGES-GFP (a, b) and CrGES-GFP c in cytosol and plastid/stromules of Catharanthus roseus cells, respectively. Co-localization of the two fluorescence signals appeared in yellow when merging the two individual (green/red) color images d. The cell morphology is observed with differential interference contrast (DIC) microscopy. Bars correspond to 10 µm. (Color figure online)
