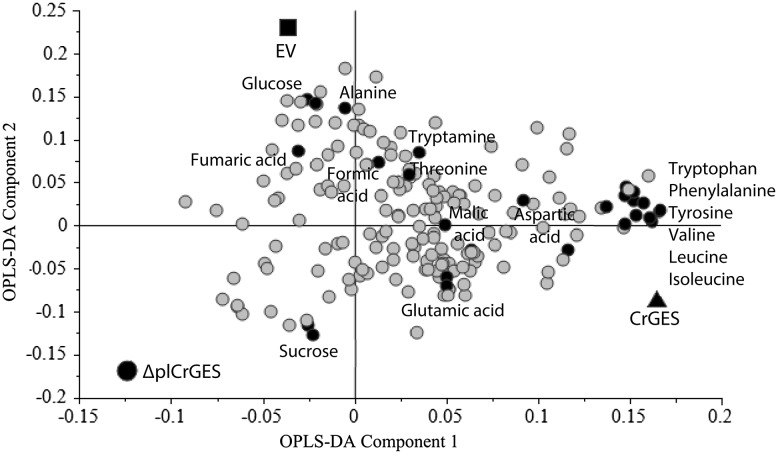
Fig. 5.
Loading plot of orthogonal projection to latent structures-discriminant analysis (OPLS-DA) of Catharanthus roseus cells constitutively overexpressing CrGES, ΔplCrGES, and the control C. roseus cells transformed with empty vector (EV). Variables X (metabolite signals) located closely to variable Y (CrGES, ΔplCrGES, EV) contributes to the separation of the samples. The grey circles are the metabolites signals and the dark black circles are the signals of identified metabolites listed in the Table 1

