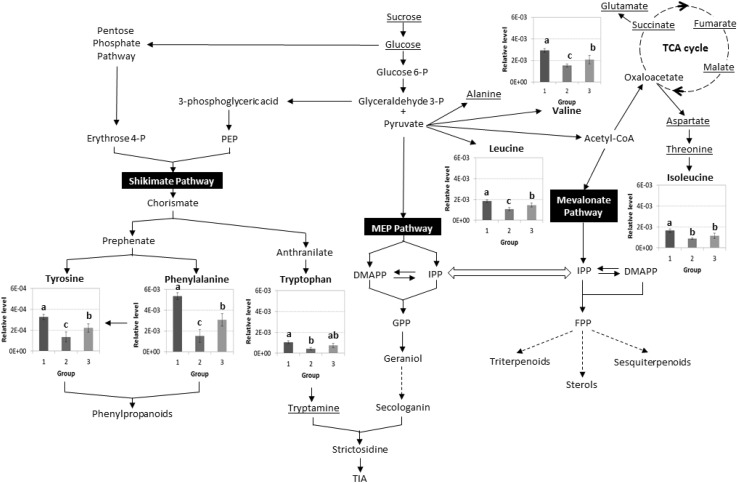
Fig. 6.
Schematic representation of metabolic differences between Catharanthus roseus cell lines overexpressing CrGES in the plastids (1), ΔplCrGES in cytosol (2), and empty vector/control (3). Relative level of metabolites is the mean area of 1H-NMR resonance peak associated to that metabolite. Each group consists of three to five different cell lines and each cell line is represented by three biological replicates. Means ± SD with different letters are significantly different (P < 0.05) using ANOVA followed by Duncan’s multiple range test (DMRT). Underlined metabolites are not significantly different in levels

