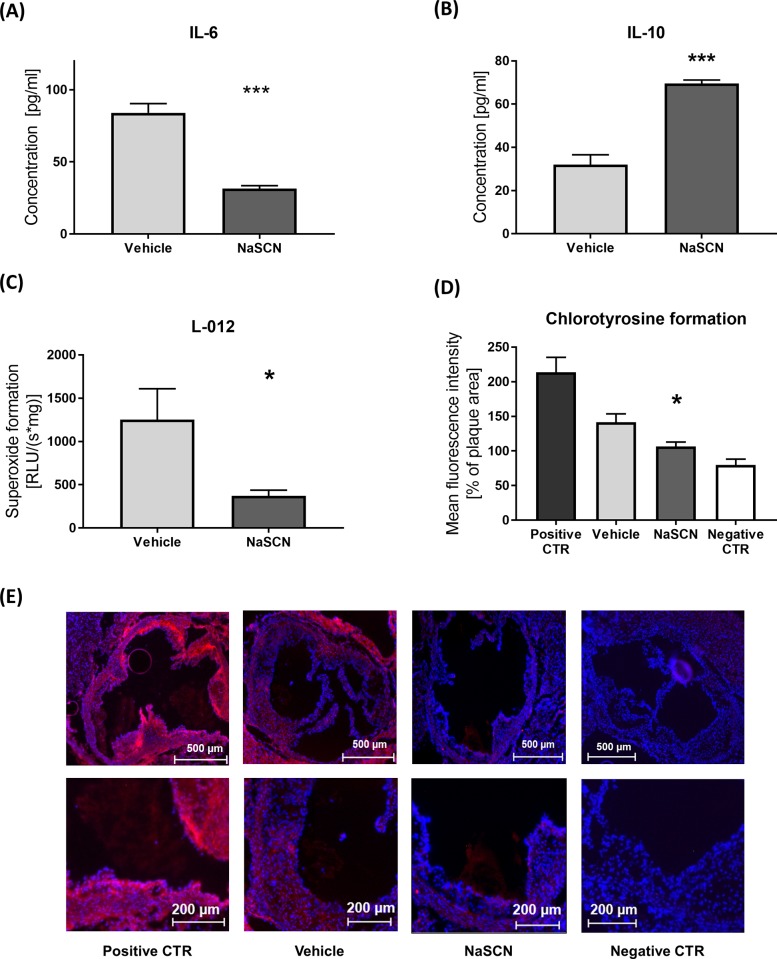
Fig 3. Assessment of IL-6 and IL-10 plasma levels and ROS / chlorotyrosine formation in ApoE-/- mice upon NaSCN treatment or DMSO as vehicle.
(A + B) Plasma IL-6 and IL-10 levels upon NaSCN treatment measured by ELISA, n = 4. (C) Measurement of ROS formation in aortic segments by L-012 chemiluminescence, n = 4. (D) Quantification of HOCl-dependent tissue damage via immunohistological staining of 3-cholortyrosine in the atherosclerotic plaque area, n = 4. (E) Representative images of Chlorotyrosine staining, positive control after incubation with 0.005% HOCl for 1 hour, negative control only with secondary anti-body (Red chlorotyrosine, Blue DAPI). Data are presented as the mean ± SEM., n = 4, *p ≤ 0.05, ***p ≤ 0.005 vs. vehicle.

