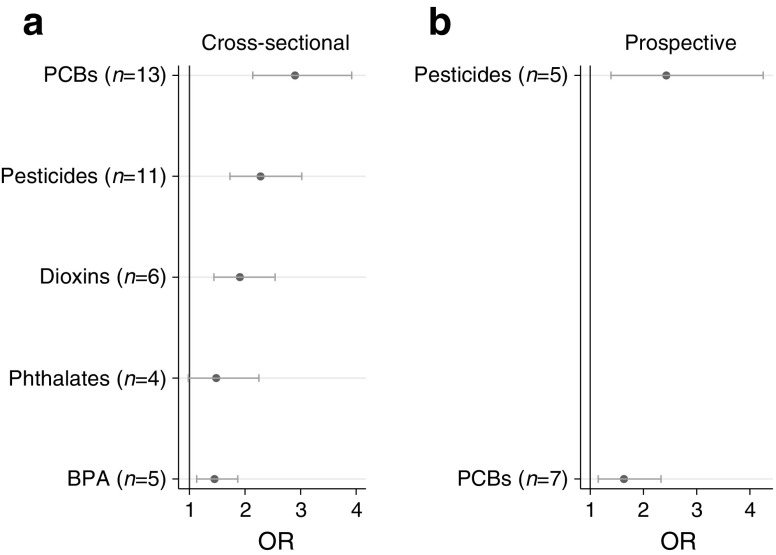
Fig. 1.
Summary of a meta-analysis of available cross-sectional (a) and prospective (b) studies on the association between environmental contaminants and diabetes published in 2016 by Song et al [3]. ORs (circles) and 95% CI (horizontal bars) are shown and are based on comparisons between the highest and lowest values presented in the different studies underlying the meta-analysis. The number of studies concerning each of the different chemical classes is shown in parentheses. This figure is available as a downloadable slide

