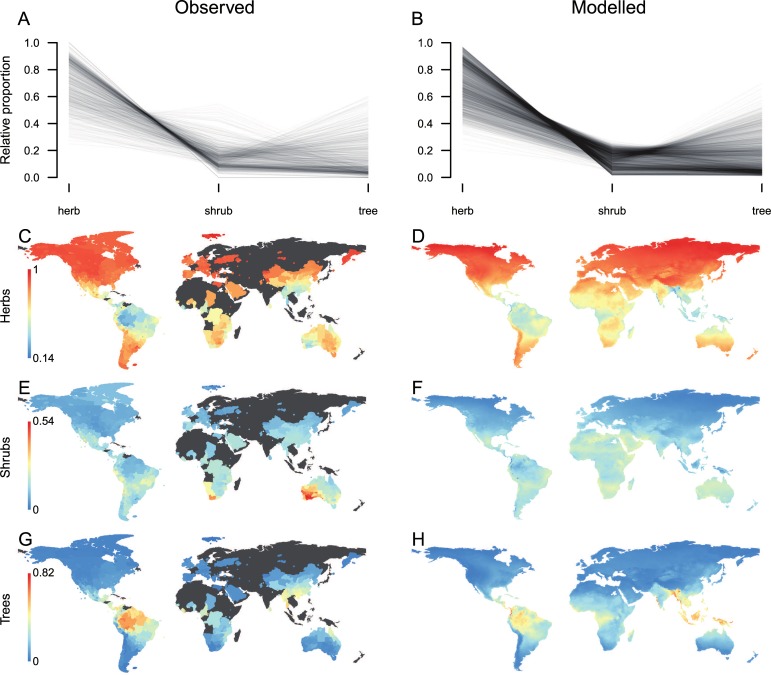
Fig 3.
The global composition in plant growth form as observed for 818 angiosperm floras (left) and modeled for 6,495 equal-area grid cells (right). Upper plots summarize the growth form spectra across all observed (A) and modeled (B) geographical units, with each line representing a single flora. Lower plots (C–H) show the observed and modeled geographic variation in the proportion of herbs, shrubs, and trees individually. Note that the range of values varies across growth forms. The underlying data and data references for this figure can be found in S1 Data.

