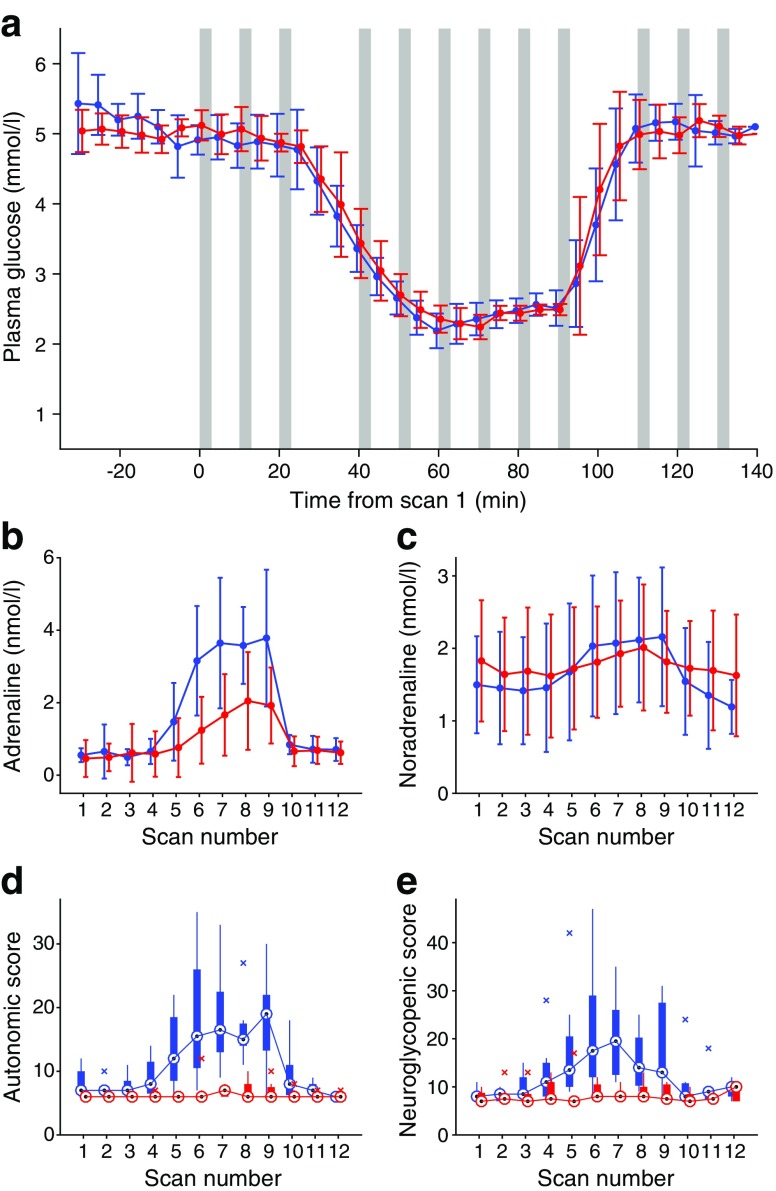
Fig. 1.
Plasma glucose, catecholamine and symptom responses. Blue lines, HA; red lines, IAH. (a) Plasma glucose levels (mean ± SD). Grey bars represent scan time points. iAUC was not significantly different between groups. (b, c) Mean ± SD at each scan for (b) plasma adrenaline (iAUC, p = 0.007 between groups) and (c) plasma noradrenaline (significant response to hypoglycaemia in HA only (p < 0.009); no significant difference in iAUC between groups. (d, e) Box plots showing median (circles), upper and lower quartiles (box), range (vertical lines) and outliers (crosses) for (d) autonomic symptom scores and (e) neuroglycopenic symptom scores. For both (d) and (e), difference between groups, p = 0.002

