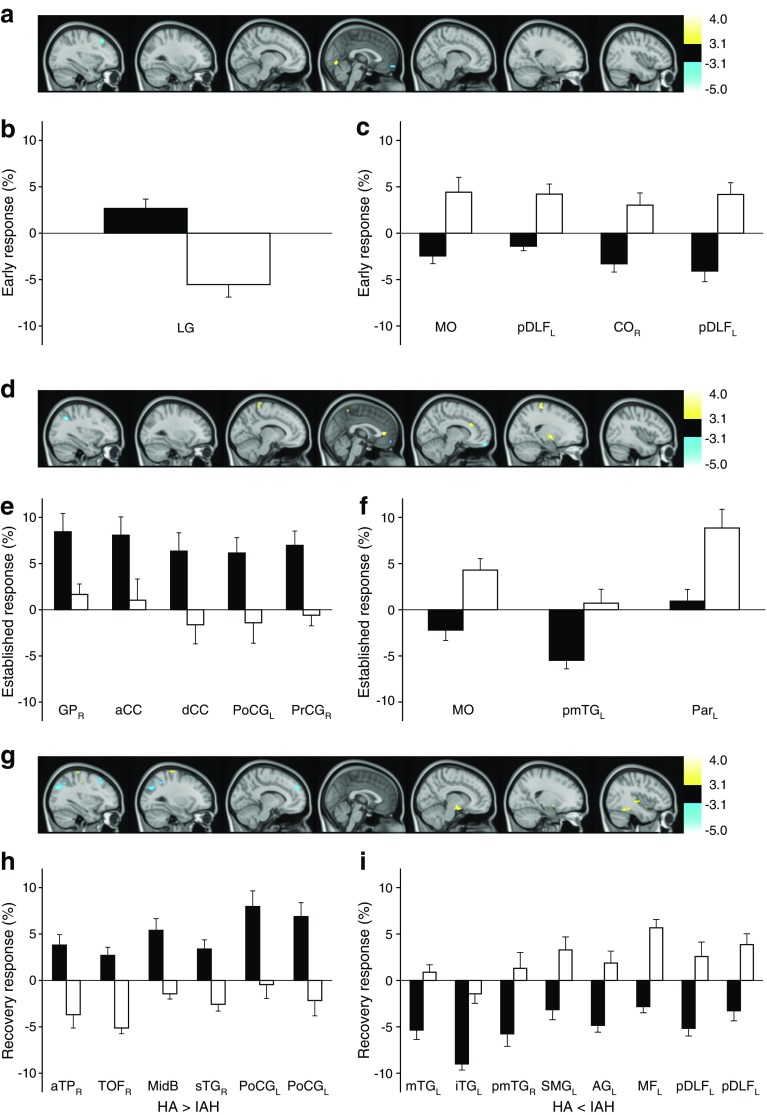
Fig. 3.
SPM2 results for comparisons of HA and IAH responses to hypoglycaemia (see Table 1). (a, d, g) Images showing regions with significantly different responses between HA and IAH to early (a), established (d) and recovered (g) hypoglycaemia (change from baseline). Changes were detected using SPM2 statistical thresholds set at voxelwise p < 0.005 and k ≥ 50 voxels. No clusters were seen with stricter thresholds (k ≥ 100 voxels, p < 0.001). Yellow clusters show regions where response is significantly more positive for HA than IAH; blue clusters show regions where response is more negative in HA than IAH. t values are shown in the right-hand scale. Associated bar charts show the mean and SE of group responses for whole clusters; all between-group differences were significant, as defined above. (b, e, h) Data for clusters where response is more positive for HA than IAH in early (b), established (e) and recovered (h) hypoglycaemia. (c, f, i) Data for clusters where response is more negative for HA than IAH in early (c), established (f) and recovered (i) hypoglycaemia. Black bars, HA; white bars, IAH. a, anterior; AG, angular gyrus; CC, cingulate cortex; CO, central operculum; d, dorsal; i, inferior; L, left; LG, lingual gyrus; m, medial; MF, medial frontal cortex; MidB, midbrain; p, posterior; Par, parahippocampal gyrus; PoCG, postcentral gyrus; PrCG, precentral gyrus; R, right; s, superior; SMG, supramarginal gyrus; TG, temporal gyrus; TOF, temporal occipital fusiform gyrus; TP, temporal gyrus. Where no laterality is noted (L or R), the cluster was represented bilaterally. Where there are two data sets for one brain region, there were two clusters in that region

