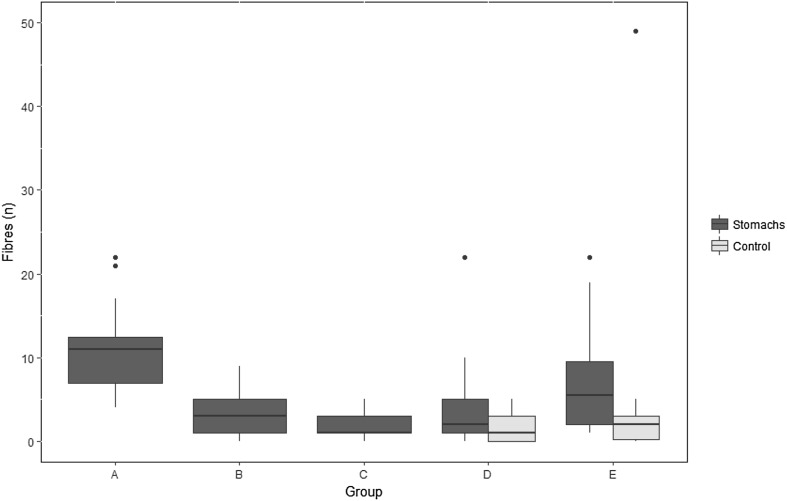
Fig. 3.
The number of fibres found in the stomachs of polar cod (Boreogadus saida, blue) according to the five different analysis protocols applied (group A–E; see Table 2 for details). Fibre controls are depicted in yellow (Groups D and E, right side). The horizontal black lines show the median number of fibres for all observations. The upper and lower limits of the coloured square boxes indicate the 25th and 75th percentile. The upper and lower limits of the vertical line indicate the minimum and maximum number of fibres in a group excluding the outliers (dots), which are numbers that are 1.5 times less or greater than the lower or upper percentiles, respectively. (Color figure online)

