Figure 2.
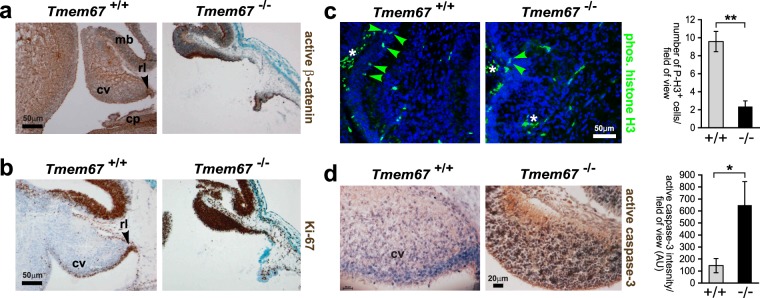
Over-proliferation and increased apoptosis at in the Tmem67−/− cerebellum at E12.5. Mid-sagittal sections of the E12.5 cerebellar vermis stained for (a) active β-catenin; (b) proliferation (Ki67); (c) mitotic cells (P-H3, phospho-Ser10 histone H3; green, indicated by arrowheads), with bar graph on right to quantitate the number of P-H3+ cells per field of view for Tmem67+/+ (+/+) and Tmem67−/− (−/−) cerebella; and (d) activated cleaved caspase-3, with bar graph on right to quantitate the intensity of IHC staining per field of view (AU; arbitrary units). In the wild-type embryonic cerebella, active β-catenin and Ki67 were largely restricted to the rhombic lip (arrowheads in a and b). Note the increase in canonical Wnt signalling (marked by active β-catenin), proliferation (Ki67) and apoptosis (active caspase-3), and the decrease in the number of mitotic cells (P-H3), in Tmem67−/− sections. Asterisks indicate non-specific staining of red blood cells in (c). Scale bars = 50μm (a–c) and 20μm (d). Abbreviation: cp, choroid plexus; cv, cerebellar vermis; mb, mid-brain; rl, rhombic lip. Statistical significance of pairwise comparisons are indicated by: *p < 0.05; **p < 0.01; for Student’s t-test (paired, two-tailed). Error bars = s.e.m. for a minimum of 4 fields of view in n = 3 biological replicates.

