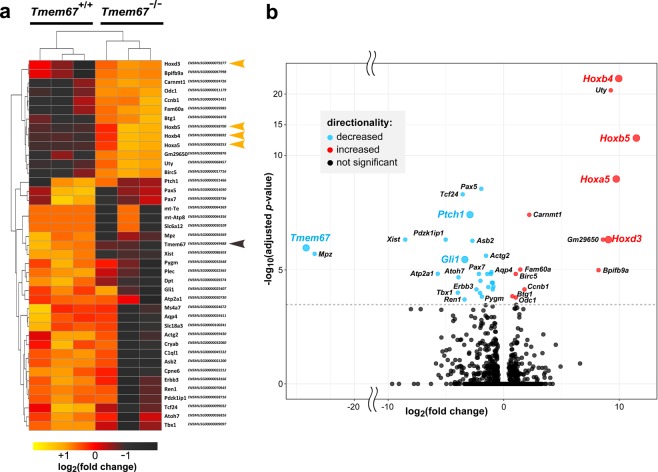
Figure 4.
Differential expression analysis of the Tmem67−/− post-natal cerebellum identifies a cluster of co-regulated homeobox transcription factors. (a) Heat map representing relative gene expression levels in early postnatal (P0) cerebella from matched littermate Tmem67+/+ and Tmem67−/− animals (n = 3 biological replicates) for the indicated genes. All statisitically significant differentially expressed genes (total n = 41; Benjamini-Hochberg p-value adjusted for false discovery rate padj < 0.01) in all three data-sets are represented. Up-regulated genes in Tmem67−/− mutants are coloured in dark-red/brown, with the co-regulated cluster of Hox genes indicated by orange arrowheads. Down-regulated genes are coloured in orange/yellow, with Tmem67 indicated by the brown arrowhead. The DESeq2 output table for significant differentially expressed genes is shown in Supplementary Table S1. (b) Volcano plot displaying the 41 genes differentially-expressed in early postnatal Tmem67+/+ and Tmem67−/− cerebella that pass statistical cut-offs of false discovery rate (FDR) padj < 0.05 and absolute log2fold change (FC) > = 1. The vertical axis (y-axis) corresponds to the statsticial significance of mean expression log10(padj value) and the horizontal axis (x-axis) displays the log2 fold-change values. Positive log2fold-changes (red points) indicate up-regulated expression in the Tmem67−/− mutant compared to the Tmem67+/+ wild-type data-sets. Negative log2fold-changes (cyan points) indicate down-regulated expression in Tmem67−/−. Genes discussed in the main text are highlighted with coloured text and larger data points.

