
Figure 2.
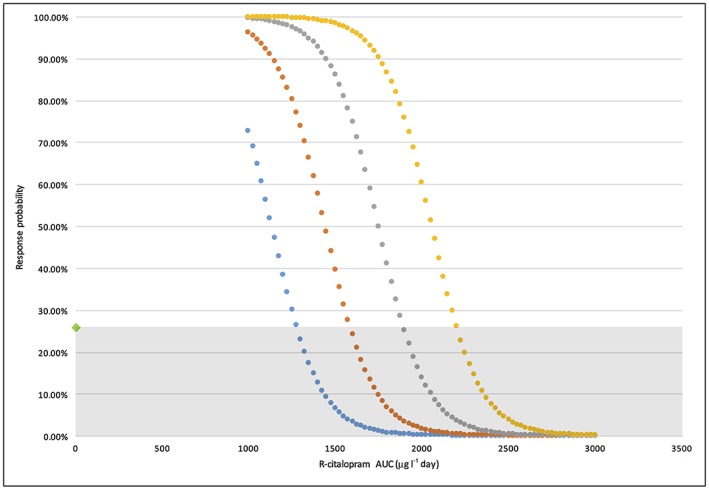
Response probability of participant mADSC‐CGIC vs. average (R)‐citalopram AUC(0,24 h). (S)‐citalopram of 500 μg l−1 day (blue); (S)‐citalopram of 1000 μg l−1 day (orange); (S)‐citalopram of 1500 μg l−1 day (grey); (S)‐citalopram of 2000 μg l−1 day (yellow); Grey shaded region: Treatment probability < placebo