
Figure 3.
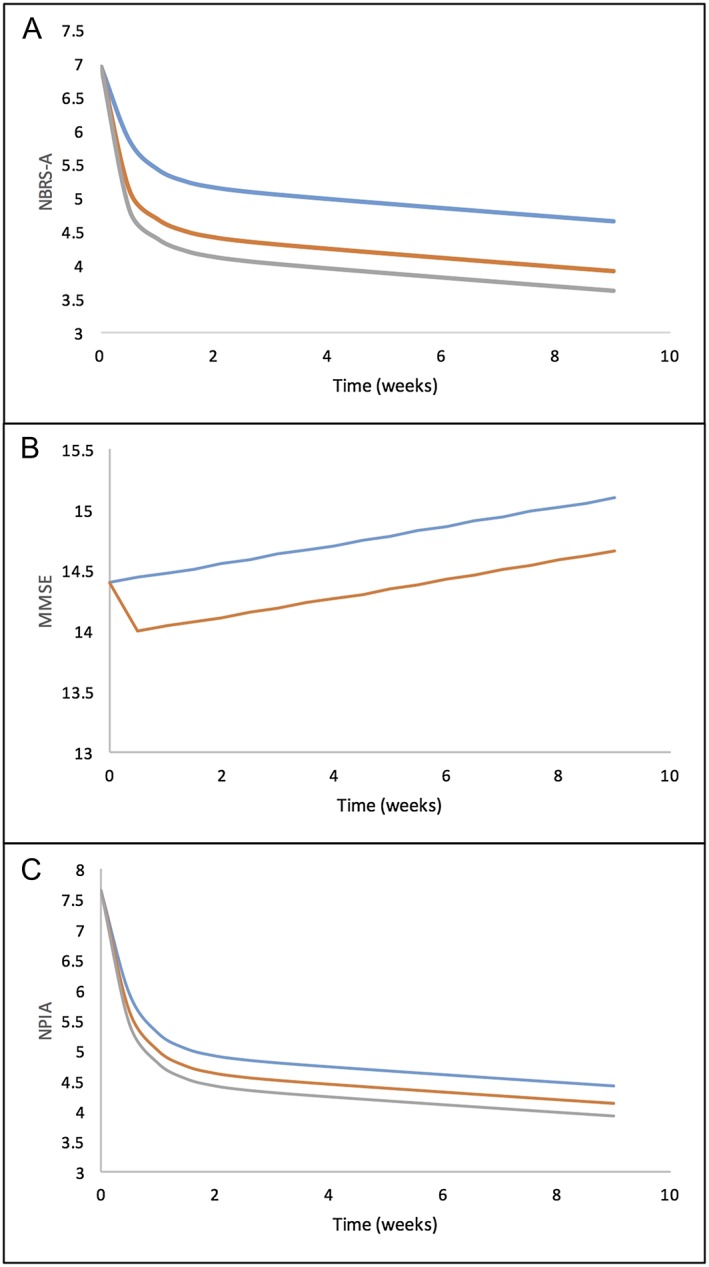
Model prediction of an average participant response in the placebo (blue line) and citalopram group (orange/grey lines). A) NBRS‐A score improvement with respect to treatment time, B) MMSE score improvement with respect to treatment time, C) NPIA score improvement with respect to treatment time. Average AUC(0,24 h) used in the model is 1500 μg l−1 day for (R)‐citalopram and 1500 μg l−1 day for (S)‐citalopram. placebo, (R)‐citalopram, (S)‐citalopram.  placebo,
  (R)‐citalopram,
  (S)‐citalopram