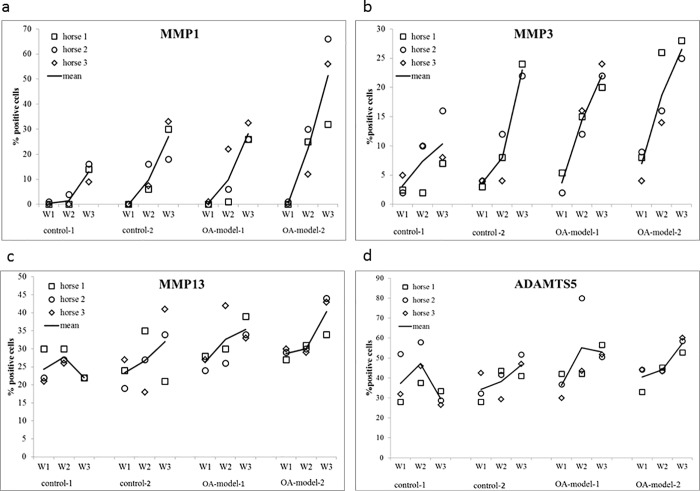
Fig 3.
Dot Plots showing the mean percentage of positive stained (IHC) cells of all three zones for a) MMP1, b) MMP3, c) MMP13 and d) ADAMTS5 for each individual horse for control groups (control 1, control 2) and OA-model groups (OA-model 1, OA-model 2) at different time points (week1 (W1), week 2 (W2), week 3 (W3)). Mean values of the three horses shown are displayed as a line.

