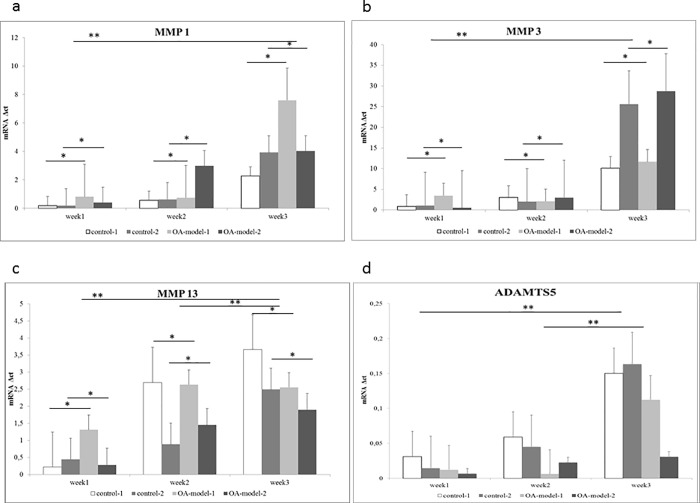
Fig 4.
mRNA expression relative to GAPDH (Δct) for a)MMP1, b)MMP3, c)MMP13 and d)ADAMTS5 for control groups (control-1, control-2) and OA models (OA-model-1, OA-model-2) at week1, week2 and week3. * P<0,05 for differences between the groups; ** P< 0,05 for differences between time-points; the individual P-values are displayed in Table 2.

