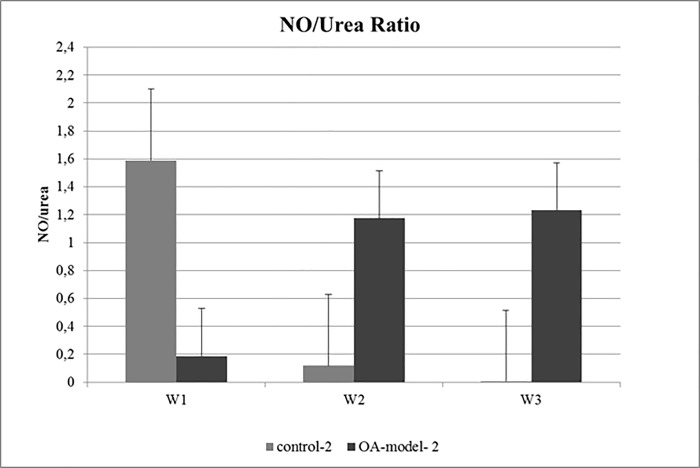
Fig 5. Mean NO/urea ratio of OA-model-2 and control-2 at week1 (W1), week2 (W2) and week3 (W3).
Control-2 showed a decrease in NO/urea ratio from week1 to week3, whereas OA-model-2 showed an increase from W1 to W2 and W3 indicating a shift of synovial macrophages toward the pro-inflammatory M1 phenotype.

