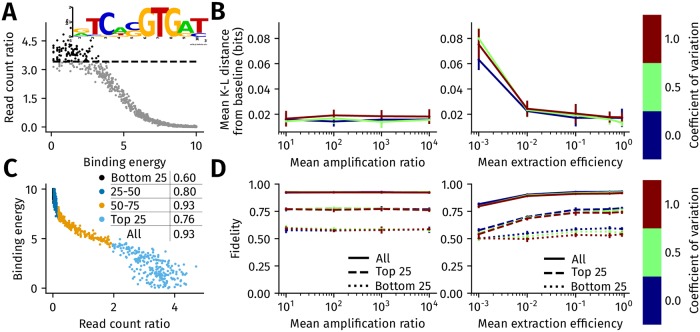
Fig 2. Impact of genome-wide heterogeneity in extraction and PCR efficiency on motif inference and ChIP-seq fidelity.
(A) To simulate motif inference, 1000 binding energies were sampled from the default binding energy distribution. A binding site sequence of transcription factor Tye7 was assigned to each binding energy (Methods). After simulating ChIP-seq in the absence of extraction and amplification ratio heterogeneity, binding sites from locations with the 100 highest read count ratios were used to construct a baseline PWM of Tye7 (shown inset). (B) The mean K-L distance between the baseline PWM and the motif inferred in the presence of heterogeneity in extraction efficiency (right) and amplification ratio (left). The heterogeneity in extraction efficiency and amplification ratio is assumed to follow a truncated normal distribution, with the mean increasing from left to right on the x-axis in both panels. The coefficient of variation of the truncated normal varies from 0 (no variation, in blue) to 0.5 (green) and 1.0 (brown). The error bars are the standard deviation in the mean K-L distance computed after PWM was estimated in 10 replicates of ChIP-seq for each mean and coefficient of variation. (C) ChIP-seq fidelity captures the monotonicity of the relationship between read count ratio and binding energy. Fidelity is defined as the probability that if a location i has a read count ratio at least 10% higher than location j, then it implies that i has a lower binding energy than j. Fidelity is calculated by sampling 1000 pairs of locations, where each pair could be from anywhere in the genome or top 25th, 25-50th, 50-75th, or bottom 25th percentiles of the read count ratio. Read count ratios falling in each percentile bin are marked in different colors in the scatter plot. The fidelity values in each of these bins is shown in the plot legend, along with the fidelity computed across all regions. (D) Variation in ChIP-seq fidelity with heterogeneity in extraction efficiency (right) and PCR amplification ratio (left). The x-axis and the three plot colors are defined identically to B. The error bars are the standard deviation in the estimate of fidelity, which are computed from 10 replicates of simulation for a given mean and coefficient of variation.

