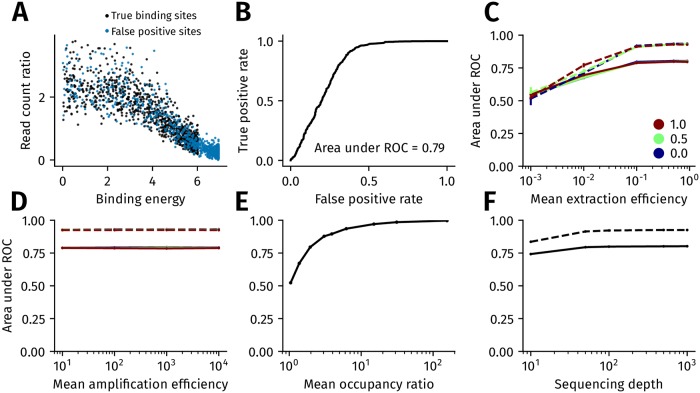
Fig 3. The impact of experimental and biological sources of variation on the sensitivity of ChIP-seq.
(A) Simulating false positive binding sites. The binding energies of false positive genomic locations, which do not contain a target TF binding site, are distributed according to a truncated power law with exponent 0.76 in the range [0, 6.78kB T]. Binding energies of true positive genomic locations, which contain a target TF binding site, are sampled from a truncated power law with exponent 0.5 in the range [0, 6kB T]. (B) Receiver operating characteristic (ROC) curve corresponding to the simulation shown in A. (C,D) Variation in auROC with the extraction efficiency and PCR amplification ratio. The mean extraction efficiency in (C) and the mean amplification ratio (after 15 cycles of PCR) in (D) increases along the x-axis. The efficiencies vary according to a truncated normal distribution with the blue, green and brown lines corresponding to a coefficient of variation of 0, 0.5 and 1.0, respectively. The solid and dashed lines are the auROC when the ratio of the mean occupancy of true positive binding sites to the mean occupancy of false positive binding sites is 2 (solid) and 10 (dashed) lines. (E) Variation in auROC with the ratio of mean occupancy between true positive and false positive binding sites. (F) Variation in auROC with sequencing depth. The ratio of the mean occupancy of true positive binding sites to the mean occupancy of false positive binding sites is set at 2 (solid line) and 10 (dashed line). In (C)-(F), the error bars are the standard deviation computed from ten replicates.

