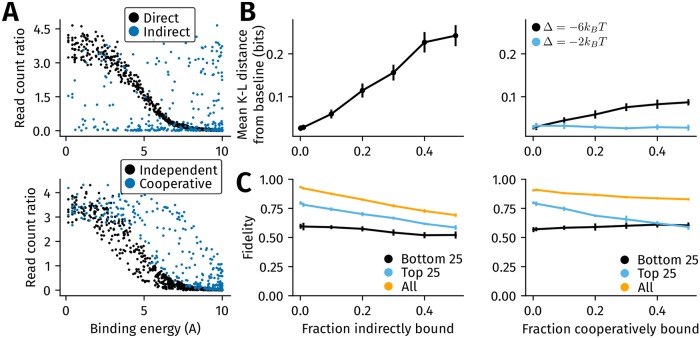
Fig 4. The relative impact of the inclusion of indirectly bound and cooperatively bound locations on motif inference and ChIP-seq fidelity.
(A) Indirect binding and cooperative binding between TFs A and B are simulated as described in Methods. The scatter plots show the read counts from simulations where 30% of genomic locations are indirectly bound (top panel) or cooperatively bound (bottom panel, interaction energy (Δ) set to −6kB T). In the top panel, the binding energy of A shown on the x-axis refers to the energy with which A would bind a location if it were in direct contact with DNA. The binding energies of A and B are sampled from a power law (with exponent 0.5) over a range of [0, 10kB T]. (B) Inclusion of indirectly bound locations [left] distorts the inferred motif more than the inclusion of cooperatively bound locations [right panel]. The change in the average K-L distance per base between the baseline motif and inferred motif (y-axis) is plotted against the fraction of indirectly bound regions [left] or cooperatively bound regions [right] on the x-axis. In the right panel, the cooperative interaction energy with the second TF is varied between −6kB T (black) and −2kB T (blue) (orange). The error bars are the standard deviation obtained from ten replicates of simulation. (C) Indirect binding has a greater impact on ChIP-seq fidelity than cooperative binding. The variation with fidelity and the fraction of indirectly bound [left] or cooperatively bound [right] locations is shown. The fidelity is calculated across all genomic locations (black), the top 25th percentile (blue) and the bottom 25th percentile (orange) of binding sites. The error bars are the standard deviation obtained from ten replicates of simulation.

