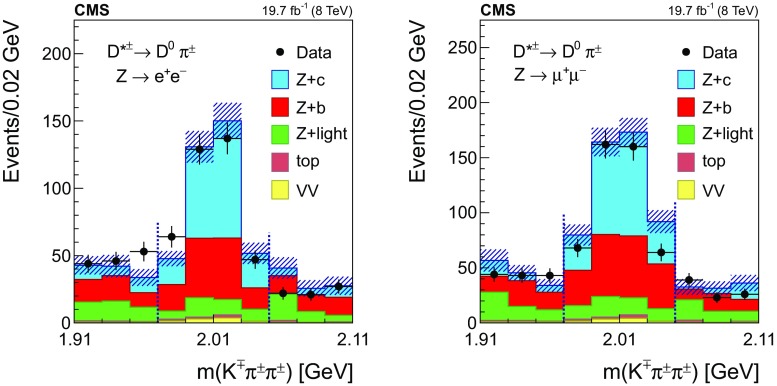
Fig. 3.
The invariant mass distribution of the three-track system composed of a two-prong secondary vertex and a primary particle for events selected in the mode, in the dielectron (left) and dimuon (right) channels. The mass assigned to each of the three tracks is explained in the text. The contributions from all processes are estimated with the simulated samples. The two dashed, vertical lines mark the mass range of the signal region. Vertical bars on data points represent the statistical uncertainty in the data. The hatched areas represent the statistical uncertainty in the MC simulation

