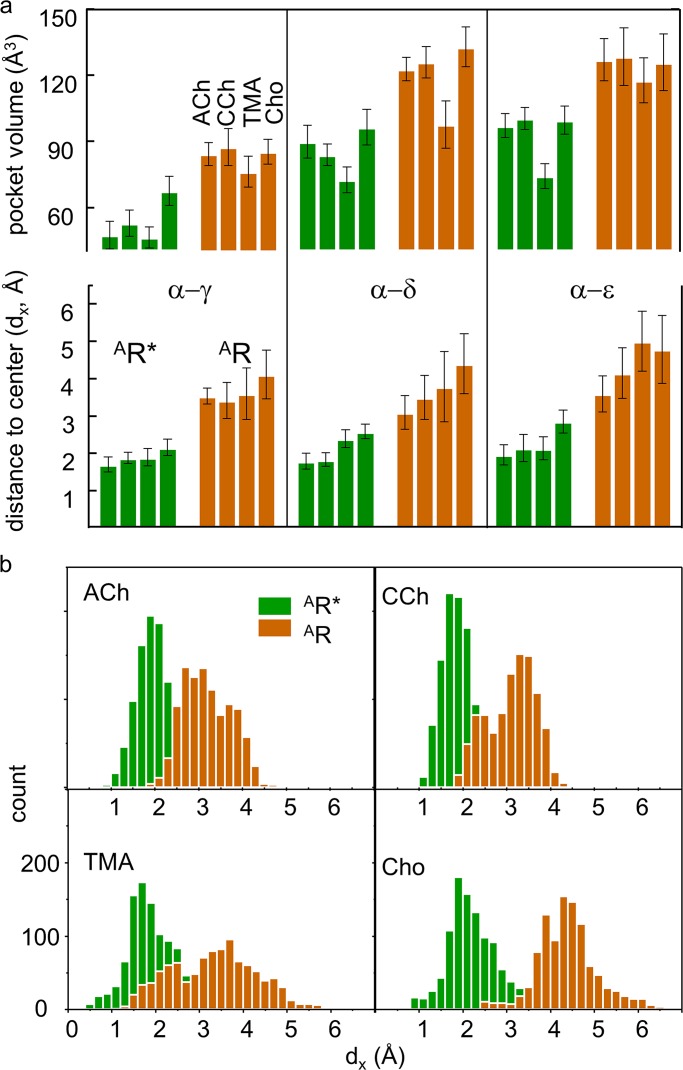
Figure 5.
Pocket volume and dx. Resting, brown and active, green. (a) Top: Pocket volume. With all agonists, α−γ is the smallest (AR and AR*). At all sites, AR* is smaller than AR (all agonists) and pocket volume is smallest with TMA. Bottom: dx. Distance between the agonist’s principal nitrogen and the pocket center is approximately twofold smaller in AR* versus AR (all sites and agonists). (b) Example dx distributions. Each panel shows results from two MD trajectories (α−γ).

