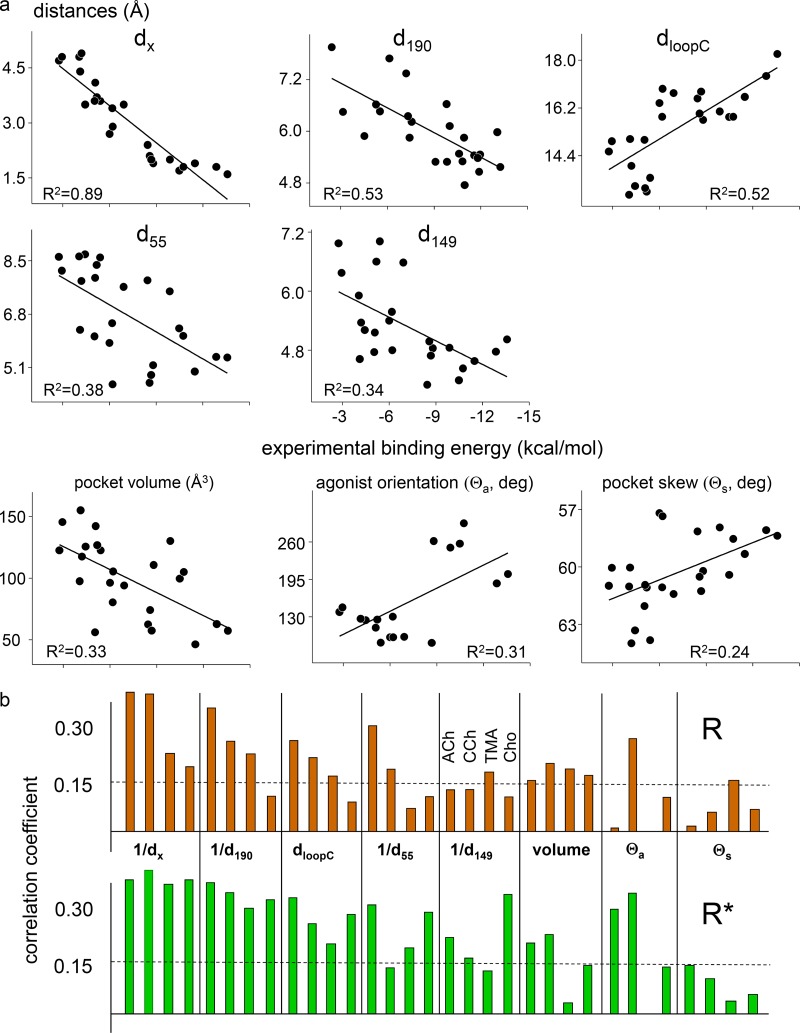
Figure 8.
Energy–structure correlations. (a) Linear correlations between experimental binding energy and binding site metrics (ACh, CCh, TMA, and Cho; all sites; AR and AR*). The highest correlation is with dx. (b) Pearson’s correlation coefficients by agonist (dashed lines, P < 0.0001 significance threshold).

