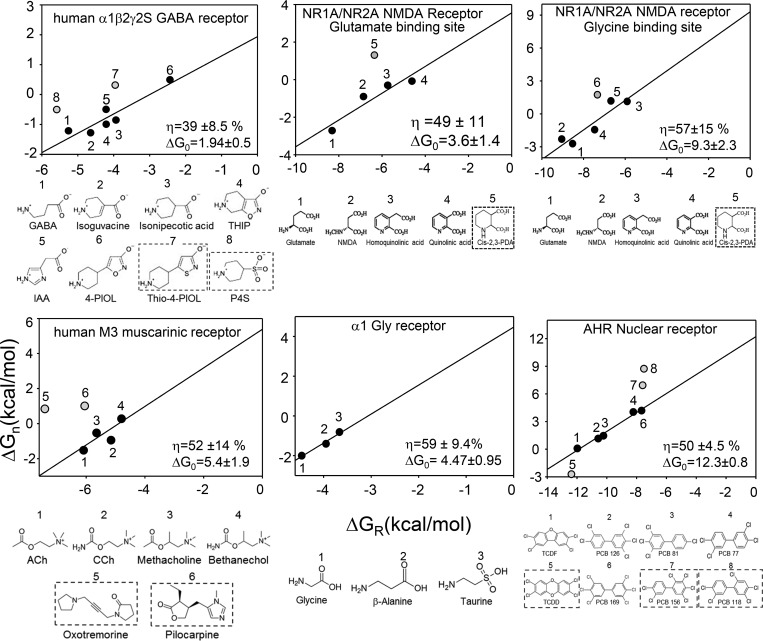
Figure 5.
Efficiency plots for other receptors. In each panel, top is the efficiency plot and bottom is the agonist structures. Energies were calculated from literature values (see text for citations). Gray symbols and boxed ligands are agonists having a different efficiency from the main group, identified statistically and excluded from the linear fit. ΔG0 is kilocalories per mole.

