Figure 2.
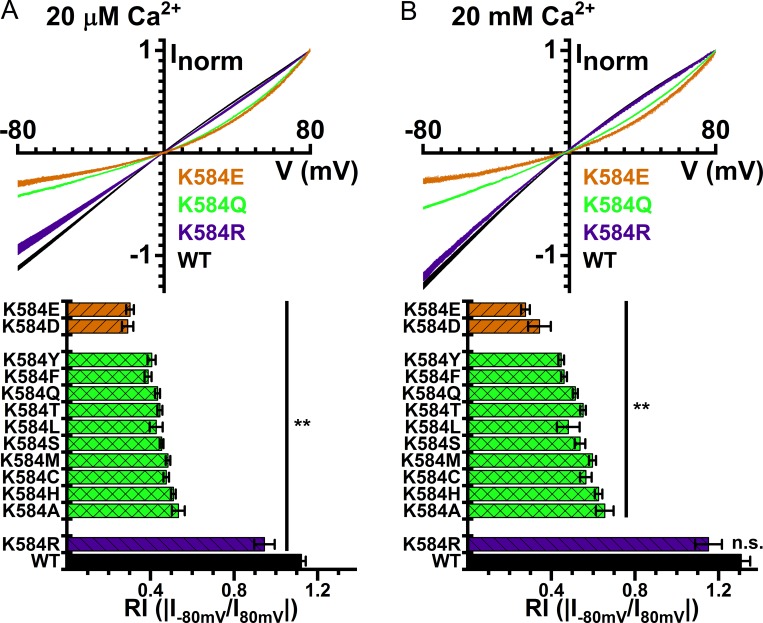
I-V curves of WT TMEM16A and mutants. I-V curves in the presence of (A) 20 μM and (B) 20 mM [Ca2+]i. Symmetrical 140 mM [Cl−]. In both A and B, averaged I-V curves of WT16A, K584Q16A, K584R16A, and K584E16A are depicted on top, while the averaged RI values (means ± SEM, n = 3–36) of the WT16A and various mutants are shown at the bottom. **, P < 0.005 by Student’s t test compared with WT16A. n.s., not significant.

