Figure 4.
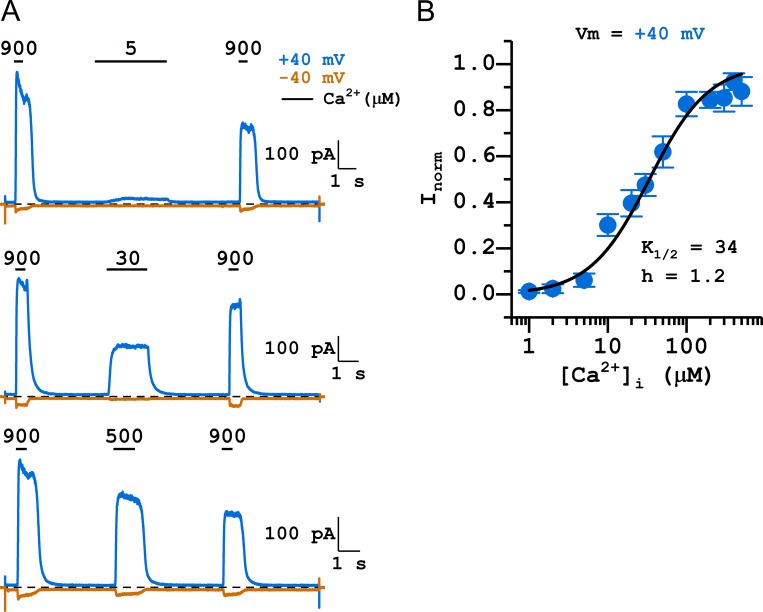
[Ca2+]i-dependent activation of WT16F. Symmetrical 140 mM [Cl−]. (A) Representative traces obtained at +40 mV (blue) and −40 mV (orange) showing the three-pulse protocol. Dashed lines are zero current level. Numbers and horizontal bars on top of the traces indicate the application of indicated [Ca2+]i (in micromolar). Notice the rapid current rundown of TMEM16F. (B) [Ca2+]i-dependent activation curve of TMEM16F. All current was normalized to that obtained with 900 µM [Ca2+]i. Data points were the average of 3–12 independent measurements (mean ± SEM). The fitted values of K1/2 and Hill coefficient (h) are shown next to the fitted curve.

