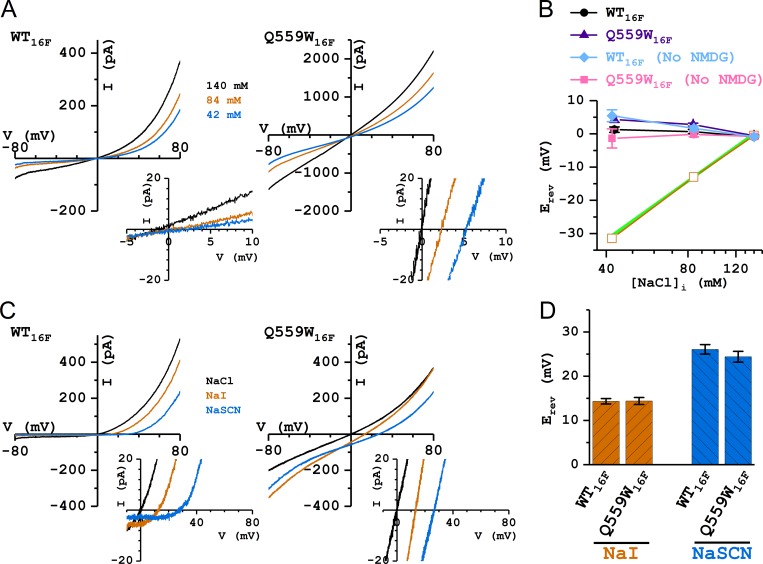
Figure 8.
Comparing ion selectivity between WT16F and Q559W16F. All recordings were with 1 mM [Ca2+]i and 140 mM [NaCl]o. (A) Representative I-V curves of WT16F and Q559W16F in 140 mM (black), 84 mM (orange), and 42 mM (blue) [NaCl]i. Insets show the expansion of the I-V curves near the zero current level. (B) Values of Erev plotted against [NaCl]i in Cl− experiments of reducing [NaCl]i with and without the replaced (NMDG)2SO4. Green line depicts a perfect Nernstian relation for Cl−. Orange squares were the mean Erev of WT16A in the same ionic conditions reproduced from Jeng et al. (2016). (C) Representative I-V curves of WT16F and Q559W16F in 140 mM [NaCl]i (black), [NaI]i (orange), and [NaSCN]i (blue). (D) Comparing bi-ionic potentials between WT16F and Q559W16F. The values of Erev show no statistically significant difference between WT16F and Q559W16F.

