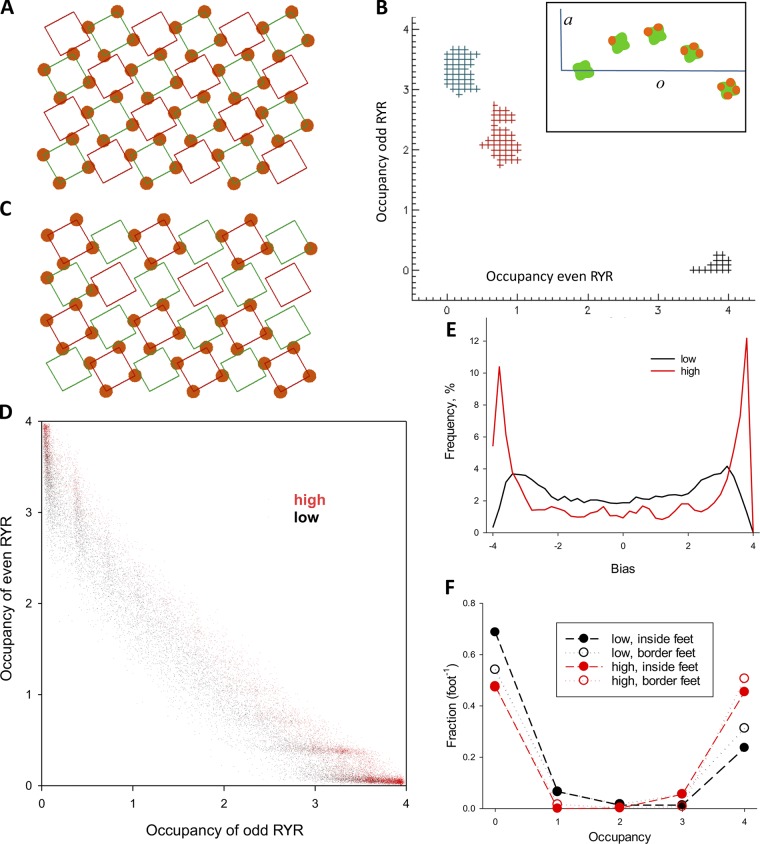
Figure 2.
Simulation outcomes. (A) A couplon of four rows and six columns in canonical configuration. Green squares represent RYR1 tetramers (channels) of the V class, so named for being occupied by four voltage sensors (CaVs). Red squares represent C channels, free from CaVs. Green and red channels are even and odd, respectively, as determined by parity of the sum of coordinates j and k. (B) Evolution of the system’s configuration in simulations with ao values represented schematically in the inset. Plus symbols plot couplon occupancies of even and odd channels (coe versus coo, defined in Eq. 8) in 2,000 successive configurations. Symbols in black represent the first set, and red and blue symbols represent configurations reached before the 106 and 2 × 10⁶ configuration. (C) Configuration reached after 2 × 10⁶ decisions. Odd channels are largely occupied, while even channels are largely free. Full occupancy of feet (by 4 CaVs) still predominates. (D) Couplon occupancies (coe versus coo) averaged over 2,000 successive configurations. The plot includes 104 averages, representing 2 × 10⁷ successive configurations: in black, those reached with the low parameter set (Table 1), and in red, configurations reached with the high parameter set. (E) Distributions of bias and difference between couplon occupancy of even and odd channels. From the distributions of bias the average asymmetry is calculated (Eq. 10). (F) Fractional occupancies f(o) for both sets of parameters. Open symbols plot fractional occupancies of border RYR tetramers (i.e., rows 0 and 3 and columns 0 and 5), while filled symbols represent fractional occupancies of inside tetramers.

