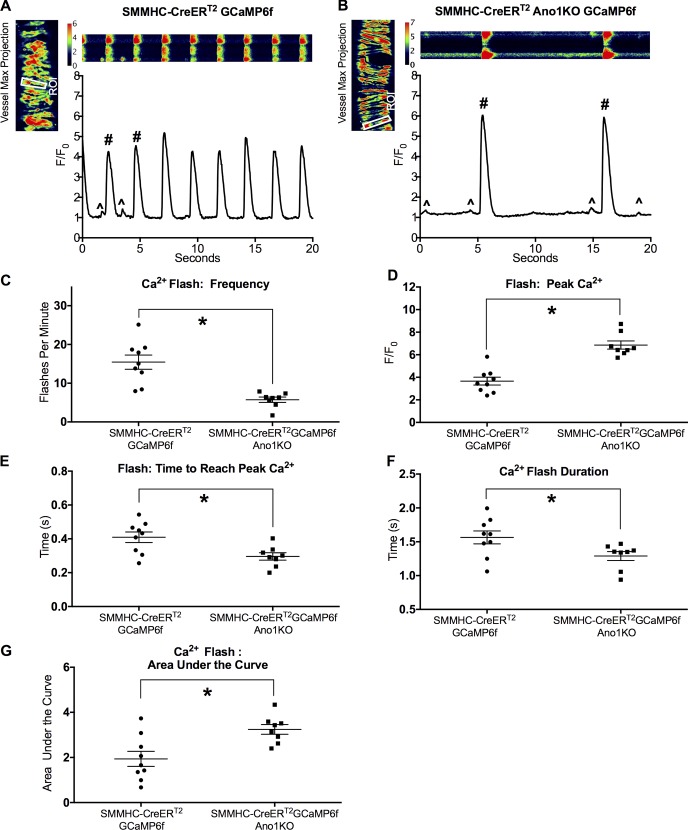
Figure 11.
Ca2+ flash analysis in pressurized IALV from SMMHC-CreERT2-GCaMP6f-Ano1KO mice. Pressurized (3 cm H2O) control SMMHC-CreERT2-GCaMP6f (A) and SMMHC-CreERT2-GCaMP6f-Ano1KO (B) vessels were imaged at 20–33 fps with a 20× objective. Image sequences were made into maximum z-stack projections to create a single-cell mask to assess Ca2+ intensity over baseline (F/F0). Ca2+ flashes (#) are indicative of action potential–generated Ca2+ influx through LTCCs, although spontaneous and local Ca2+ signals are also evident (^). Summary data for Ca2+ flash frequency (C), peak Ca2+ intensity (D), time to reach peak Ca2+ (E), Ca2+ flash duration (F), and the area under the curve (G) were measured. *, P < 0.05 comparing SMMHC-CreERT2-Ano1KO versus Ano1fl/fl with n = 9 for control, n = 8 for SMMHC-CreERT2-Ano1KO.

