Figure 2.

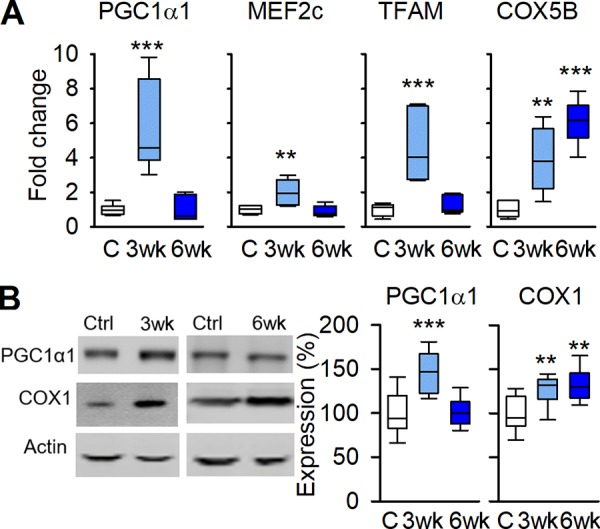
Signaling-promoting mitochondrial biogenesis follows the temporal pattern of leaky RYR1. (A) Boxplots showing mRNA expression of PGC1α1, MEF2c, TFAM, and COX5B relative to HPRT in controls and 3- and 6-wk runners; values were normalized to mean expression of sedentary controls, which was set to 1.0 (n = 6). (B) Original blots (left) and boxplots of relative expression (right) of PGC1α1 and COX1 protein with actin as loading control; data are presented relative to the mean pixel density in controls, which was set to 100% (n = 13, 6, and 7 respectively). **, P < 0.01; ***, P < 0.001, 3-wk or 6-wk vs. controls with one-way ANOVA. Box plots show median, quartiles, and min/max.
