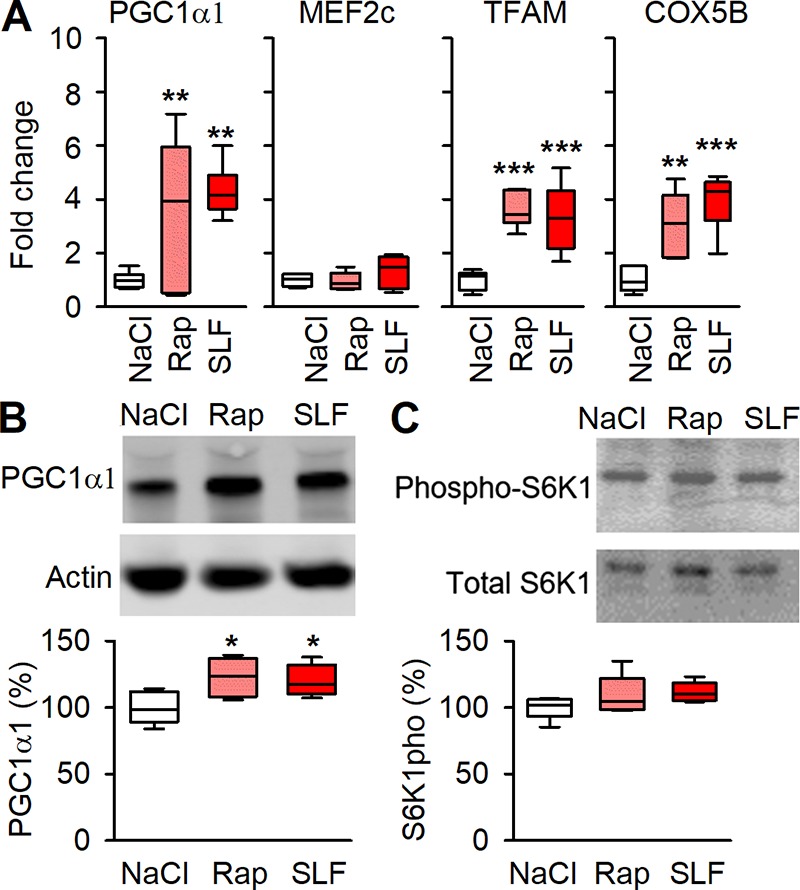
Figure 7.

Pharmacologically destabilizing RYR1 causes signaling promoting mitochondrial biogenesis. (A) Boxplots of relative mRNA expression of PGC1α1, MEF2c, TFAM, and COX5B shown relative to HPRT expression in NaCl-, rapamycin- and SLF-injected mice, values were normalized to mean expression of NaCl, which was set to 1.0 (n = 6). (B) Original Western blots (top) and boxplot of relative expression (below) for PGC1α1 with actin as loading control; data presented as relative to the average NaCl, which was set to 100% (n = 6). (C) Original Western blots (top) and boxplot of relative T412 phosphorylation per total S6K1 (below) show no significant effects of Rapamycin or SLF on S6K1; data presented relative to average NaCl which was set to 100% . *, P < 0.05; **, P < 0.01; ***, P < 0.001 Rap or SLF vs. controls (NaCl) with one-way ANOVA. Box plots show median, quartiles, and min/max.
