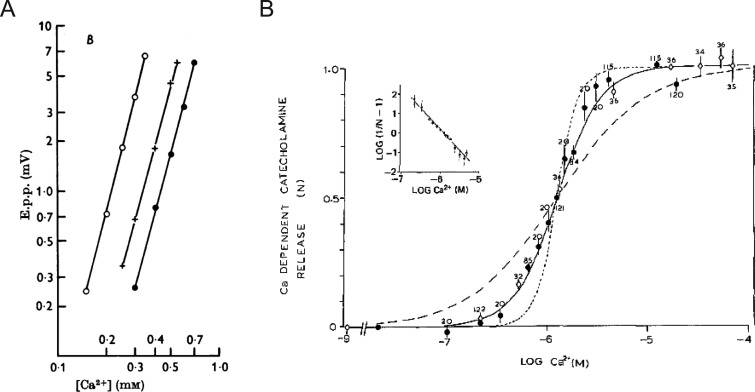
Figure 8.
The dependence of secretion on Ca2+. (A) The relationship between Ca2+ concentration and the amplitude of the end-plate potential (e.p.p.) displayed as a log–log plot. Fits at different Mg2+ concentrations are shown (open circle, 0.5 mM; plus, 2 mM; filled circle, 4 mM), all with an approximate slope of 4. This indicates that a fourth power relationship exists between the e.p.p. and Ca2+. Note, Mg2+ does not change the slope, but merely shifts the line along the x axis. Taken from Dodge and Rahamimoff (1967), A is reprinted with permission from the Journal of Physiology. (B) Catecholamine released from leaky cells as a result of raising Ca2+ concentration from 10−9 M (open diamonds) or 2 × 10⁻⁸ M (filled circle). The release (N) is expressed relative to the amount released at 10−5 M Ca2+. The numbers represent the number of observations, and error bars represent SEM. The solid line is a theoretical curve based on two Ca2+ ions involved in the secretory process; the dotted curve is based on 4; the dashed curve is based on 1. The inset is a Hill plot. The regression line has a slope of 2.2. Taken from Knight and Baker (1982), B is reprinted with permission from the Journal of Membrane Biology.

