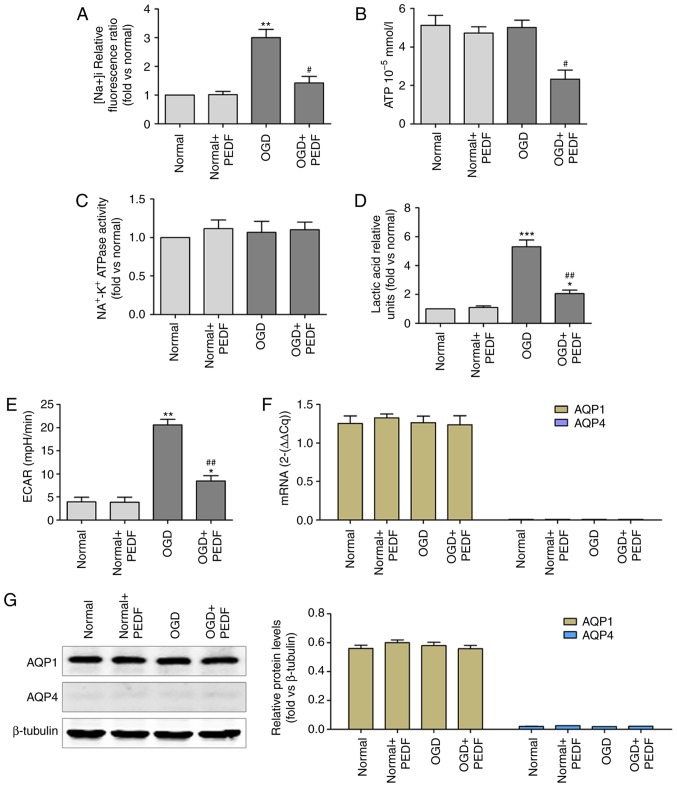
Figure 3.
PEDF reduces Na+ concentration and glycolytic activation in cardiomyocyte undergoing OGD. (A) Na+ concentration, (B) ATP concentration, (C) Na+-K+ ATPase activity, (D) lactic acid concentration, (E) extracellular acidification rate, and (F) mRNA and (G) protein expression levels of aquaporin were measured in neonatal cardiomyocytes. Cells were divided into the Normal, Normal + PEDF, OGD and OGD + PEDF groups (n=6). *P<0.05 and **P<0.01 and ***P<0.001, vs. Normal group; #P<0.05 and ##P<0.01, vs. OGD group. OGD, oxygen-glucose deprivation; PEDF, pigment epithelium derived factor; ECAR, extracellular acidification rate.

