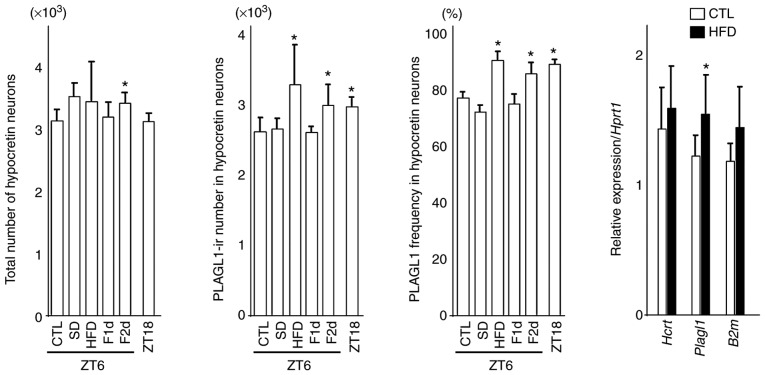
Figure 3.
Number of hypocretin neurons, PLAGL1-ir number in hypocretin neurons, frequency of PLAGL1 and relative gene expression in hypocretin neurons. Differences in the count of hypocretin neurons, PLAGL1 counts and PLAGL1 immunopositivity were compared using one-way analysis of variance followed by Steel's post hoc test. *P<0.05 vs. the control (CTL) group (ZT6). Four or five animals from each group were used for each immunohistochemical analysis. The differences in relative gene expression were compared using two-tailed Student's t-tests for hypocretin and Plagl1 expression, and two-tailed Welch's t-test for B2m. Eight animals from each group were used for gene expression analysis. B2m, β-2-microglobulin; CTL, control (mice sacrificed at ZT6); F1d, 1 day of fasting; F2d, 2 days of fasting; Hcrt, hypocretin; HFD, high-fat diet; ir, immunoreactive; Plagl1, pleomorphic adenoma gene-like 1; SD, 6 h of sleep deprivation; ZT, Zeitgeber time; ZT18, mice sacrificed at ZT18. Bars indicate means, and error bars represent standard deviations.

