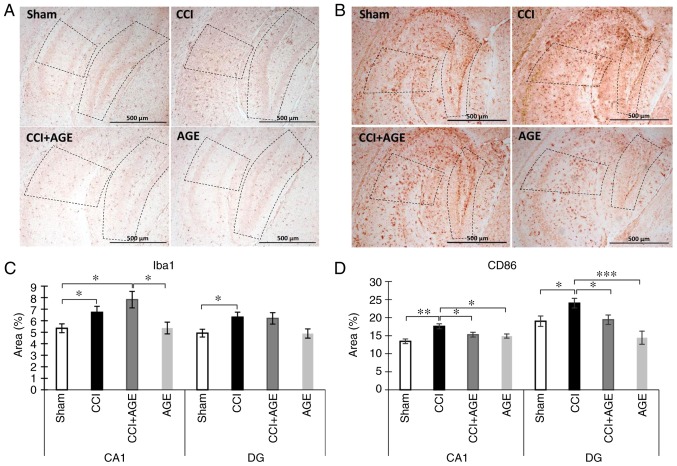
Figure 3.
Effects of CCI and AGE treatment on microglial activation. (A) Representative images of Iba-1 immunohistochemically-stained slides. (B) Representative images of CD86 immunohistochemically-stained slides. (C) Histogram demonstrating the percentage of area covered by Iba-1-positive staining in the CA1 hippocampal region at 14 days after surgery. Data are the means ± SEM, n=7 per group, *P<0.05. (D) Histogram demonstrating the percentage of area covered by CD86-positive staining in the CA1 hippocampal region at 14 days after surgery, %. Data are the means ± SEM, n=7 per group, *P<0.05, **P<0.01 and ***P<0.001. Scale bar, 500 µm. Images were taken at x100 magnification. The dotted line indicates the boundaries of the CA1 and DG regions. AGE, alkyl glycerol ethers; Sham, sham-operated; CCI, chronic constriction injury; DG, dentate gyrus.

