Figure 1.

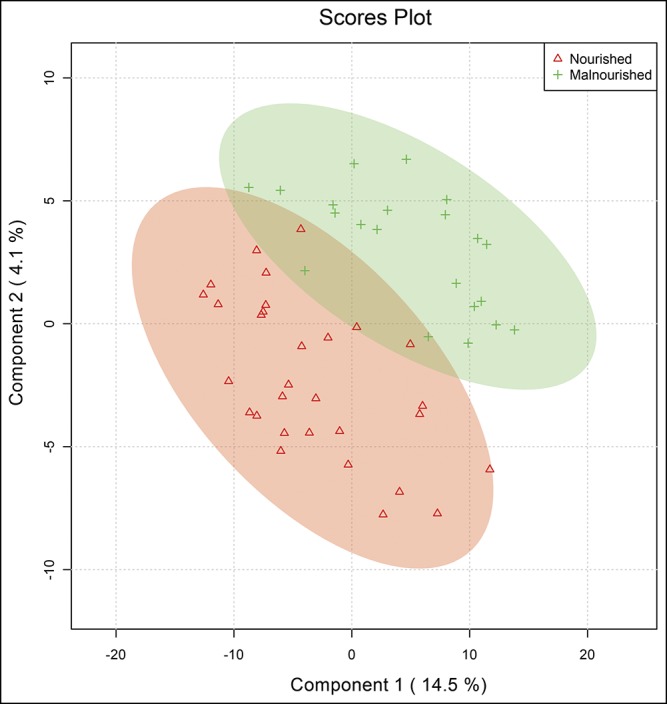
Partial least squares discriminant analysis of metabolomics data reveals clustering of data into separate nourished and malnourished cohorts.

Partial least squares discriminant analysis of metabolomics data reveals clustering of data into separate nourished and malnourished cohorts.