Table 3.
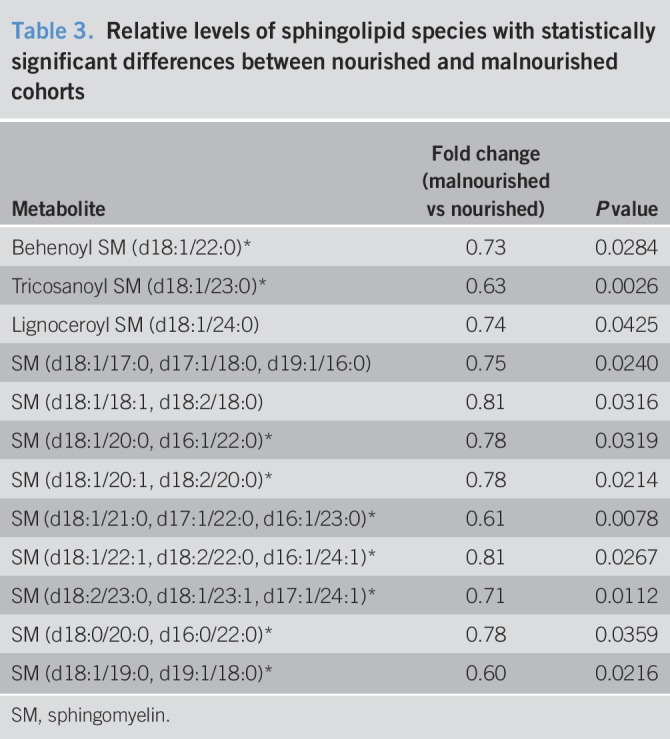
Relative levels of sphingolipid species with statistically significant differences between nourished and malnourished cohorts

Relative levels of sphingolipid species with statistically significant differences between nourished and malnourished cohorts
