
FIGURE 3.
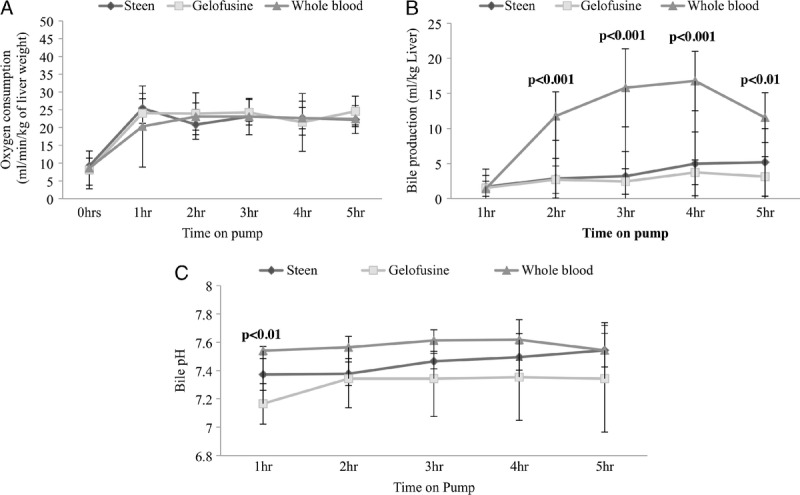
OC and bile production during NEsLP. OC was stable since the 1 hour of perfusion without differences between the groups (A). Bile production was significantly higher in the WB group since 2 hours of NEsLP (B). Significantly higher bile pH was found in the WB at 1 hour of perfusion compared to the rest of the groups (Steen, 7.37 ± 0.13 vs Gelofusine, 7.16 ± 0.12 vs WB, 7.49 ± 0.05; P < 0.01) (C). Results are expressed as mean ± SD. Six experiments were performed per group (n = 6). One-way ANOVA was used for all the analyses (A, B, C). ANOVA, analysis of variance; NEsLP, normothermic ex situ liver perfusion; OC, oxygen consumption; SD, standard deviation; WB, whole blood.