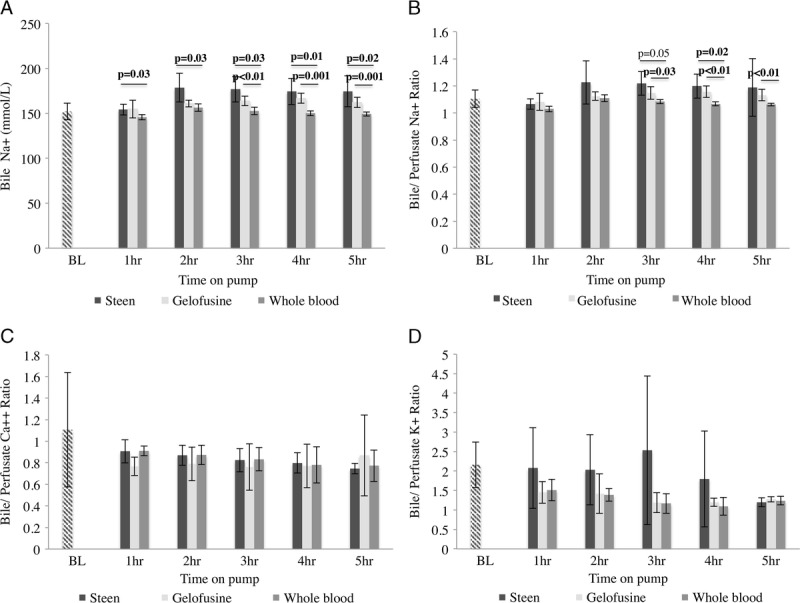
FIGURE 5.

Bile electrolytes. Bile analysis showed higher Na+ concentration in Steen group since the 2 hours of perfusion compared with Gelofusine and WB group (A). The bile/perfusate Na+, Ca++ and K+ ratios also showed higher values in the Steen group compared with Gelofusine and WB groups at the majority of the timepoints (B, C, D). Results are expressed as mean ± SD. Six experiments were performed per group (n = 6). Student t test was used to perform all the analyses. Note: BL bile and serum samples represent samples taken directly from the bile duct and central line of donor pigs before any intervention, respectively; SD, standard deviation; WB, whole blood.
