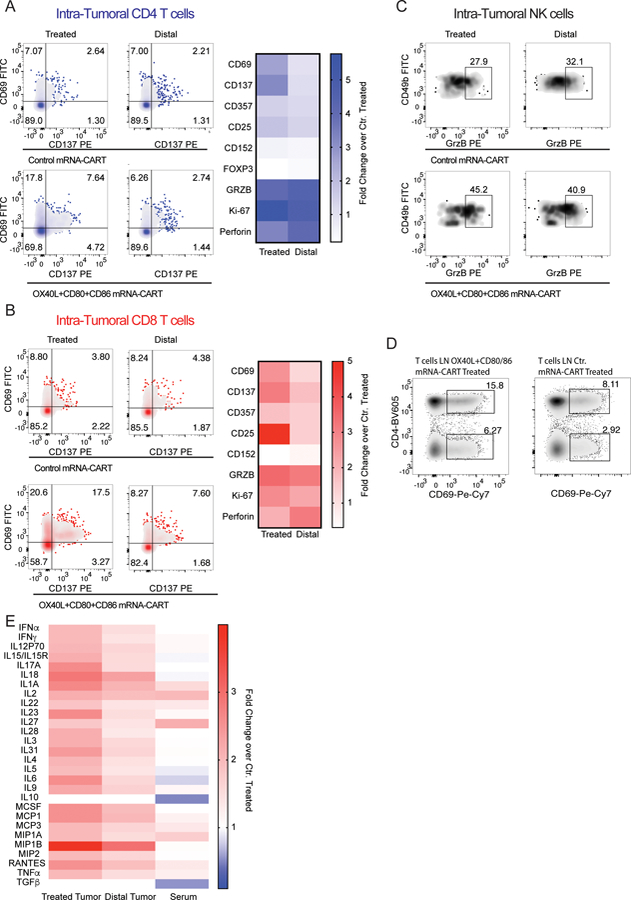
Figure 3. In situ therapy with a combination of OX40L and CD80/86 induces local activation of T cells and secretion of pro-inflammatory cytokines that can be traced to the local draining lymph node and the distal non-treated tumor.

Balb/c mice bearing two A20 tumors on opposite flanks were injected with either 5ug OX40L, CD80 and CD86 mRNA-CART or 5ug control mRNA-CART on one flank. 36 hours later, serum, and tumor extracellular matrix was collected. In addition, single cell suspension of treated, non-treated, and draining lymph nodes were generated (A) Left: Representative plots of activation marker CD137 and CD69 expression by intratumoral CD4 T cells from treated and distal tumors of control mRNA-CART and OX40L, CD80 and CD86 mRNA-CART treated mice. Right: fold change in expression of activation and cytotoxic markers by intratumoral CD4 T cells in both treated and untreated tumors from OX40L, CD80 and CD86 mRNA-CART treated mice compared to tumors from control mRNA-CART treated mice. (B) Left: Representative plots of activation marker CD137 and CD69 expression by intratumoral CD4 T cells from treated and distal tumors of control mRNA-CART and OX40L, CD80 and CD86 mRNA-CART treated mice. Right: fold change in expression of activation and cytotoxic markers by intratumoral CD8 T cells in both treated and untreated tumors from OX40L, CD80 and CD86 mRNA-CART treated mice compared to tumors from control mRNA-CART treated mice. (C) Representative plots of cytotoxicity marker granzyme B on intratumoral CD49b positive Natural Killer cells from treated and distal tumors of control mRNA-CART and OX40L, CD80 and CD86 mRNA-CART treated mice. (D) Representative plots of activation marker CD69 expression by tumor draining lymph node CD4 T cells from treated and distal tumors of control mRNA-CART and OX40L, CD80 and CD86 mRNA-CART treated mice. (E) Fold change in secreted cytokine protein levels in the local tumor microenvironment of both treated and untreated tumors, and serum from OX40L, CD80 and CD86 mRNA-CART treated mice, compared to tumors and serum from control mRNA-CART treated mice. Data representative of 2 independent experiments.
