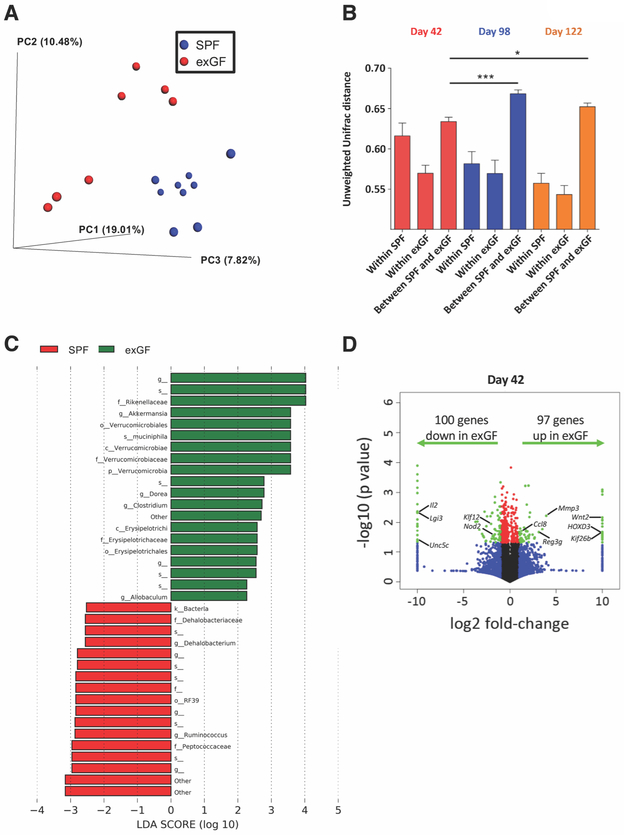
Figure 2. ExGF mice exhibit altered microbiota composition and intestinal gene expression.
A, Microbiota composition was analyzed by 16S rRNA sequencing at day 42. PCoA of the unweighted Unifrac distance, with samples colored by group (SPF: blue, n=9 and exGF: red, n=7). ANOSIM P < 0.01. B, Unweighted Unifrac distance within and between SPF and exGF groups at day 42 (red), day 98 (blue), and day 122 (orange). Data are means ± SEM. *P < 0.05, ***P < 0.01. C, LEfSe analysis investigating the bacterial taxa significantly increased (green) or decreased (red) in exGF mice compared to SPF mice. D, RNA-seq data were visualized on a volcano plot comparing gene expression in SPF and exGF mice. For each gene, the difference in abundance between the two groups is indicated in log2 fold-change on the x-axis, with positive values corresponding to increased expression in exGF mice compared to SPF mice and negative values corresponding to decreased expression in exGF mice compared to SPF mice. Significance between the two groups is indicated by –log10 P-value on the y-axis. Red dots correspond to genes with a P-value <0.05 between exGF and SPF mice. Blue dots correspond to genes with at least a 2-fold decreased or increased expression in exGF and SPF mice. Green dots correspond to genes with at least a 2-fold decreased or increased abundance in exGF and SPF mice and a P-value <0.05. One-way ANOVA and Bonferroni post-hoc test was used to determine significance. Data are from (C,D) one or (A,B) two independent experiments.

