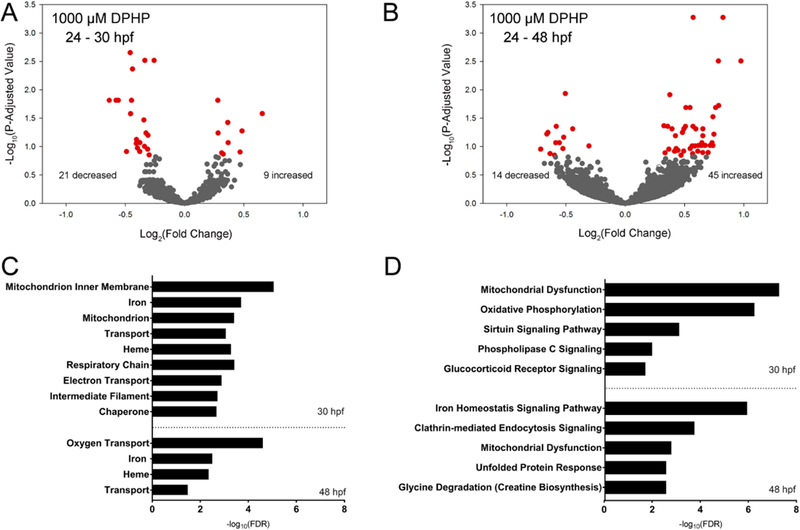
Figure 4.

Transcriptional effects of DPHP at 30 and 48 hpf. Volcano plots showing the number of significantly different transcripts (red circles) following exposure to 1000 μM DPHP from 24 to 30 hpf (A) or 24−48 hpf (B); log2-transformed fold change is plotted on the x-axis and log10-transformed p-adjusted value is plotted on the y-axis. DAVID-based (UP_Keyword) processes (C) and IPA-based (canonical) pathways (D) affected by DPHP were identified using a Fisher’s exact p-value ≤ 0.05.
