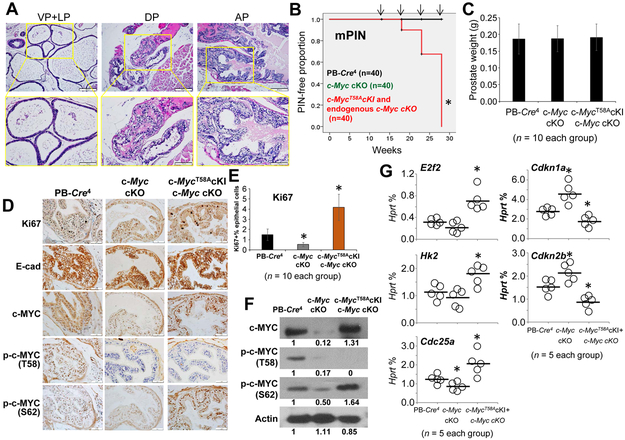
Figure 5. Effects of c-Myc T58A mutagenesis in mouse prostate.
A. Histologic analysis in the ventral (VP), lateral (LP), dorsal (DP), and anterior (AP) lobes of the prostates from 28-week-old prostate c-MycT58A knock-in (cKI) mice under endogenous c-Myc cKO (PB-Cre4+c-Mycflox/floxc-MycT58AcKI), identified by H&E staining. B. Kaplan-Meier curve of mPIN in PB-Cre4+ control, c-Myc cKO, and c-MycT58A cKI + c-Myc cKO mice. Arrows indicate time points of animal sacrifice (n=10 mice/per time point). * p < 0.05, log-rank test vs. PB-Cre4 control mice. C. Weights of prostates in the mice at 18 weeks of age. Data are presented as the means and SD. D. Representative IHC staining of Ki67, E-cadherin, c-MYC, pT58-c-MYC, and pS62-c-MYC in the anterior prostates of 18-month-old PB-Cre4+ control, c-Myc cKO, and c-MycT58A cKI + c-Myc cKO mice. E. The percentage of Ki67+ prostate epithelial cells among the mouse prostate tissues. Data are presented as the means and SD. * p < 0.05, two-tailed t test vs. PB-Cre4 control mice. F. Protein expression levels of c-MYC, pT58-c-MYC, and pS62-c-MYC in the prostates of PB-Cre4+ control, c-Myc cKO, and c-MycT58A cKI + c-Myc cKO mice at 18 weeks of age as determined by Western blots. G. Relative mRNA levels of c-MYC target genes as a percentage of Hprt expression in micro-dissected prostate epithelial cells as determined by qPCR in the mice at 18 weeks of age. Horizontal lines represent the average values. * p < 0.05 by one-way ANOVA followed by protected least-significant difference test vs. the PB-Cre4+ control group. All experiments were repeated two times.

