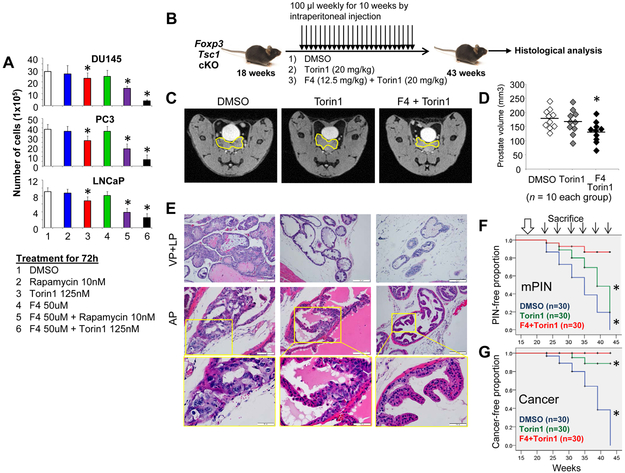
Figure 6. Effects of dual targeting c-MYC and mTOR on prostate tumor progression in Foxp3 and Tsc1 double cKO mice.
A. Cells were exposed to DMSO, rapamycin, Torin1, 10058-F4, or their combinations. Data are presented as the means and SD of the cell numbers. * p<0.05, by one-way ANOVA followed by protected least-significant difference test vs. DMSO group. Rap: rapamycin; F4: 10058-F4; DMSO: dimethyl sulfoxide. B. Timeline of the therapeutic delivery of drugs. Foxp3 and Tsc1 double cKO littermates were dosed intraperitoneally with DMSO or Torin1 or Torin1+F4 weekly (black arrows). C. Representative MRI images of the prostates (outlined in yellow) of 40-week-old mice. D. Prostate volumes of individual mice. * p<0.05, by one-way ANOVA followed by protected least-significant difference test vs. the group dosed with DMSO. Horizontal lines represent the average values. E. Histologic analysis in the ventral (VP), lateral (LP), and anterior (AP) lobes of prostates from Foxp3 and Tsc1 double cKO mice after treatment, identified by H&E staining. F and G, Kaplan–Meier curves of mPIN and cancer incidences in the mice at 43 weeks of age after treatments. Large white arrow, starting time of treatment. Thin arrows, time points of mouse sacrifice (n=5 mice/per time point). * p<0.05, log-rank test vs. the DMSO group. All experiments were repeated two times.

