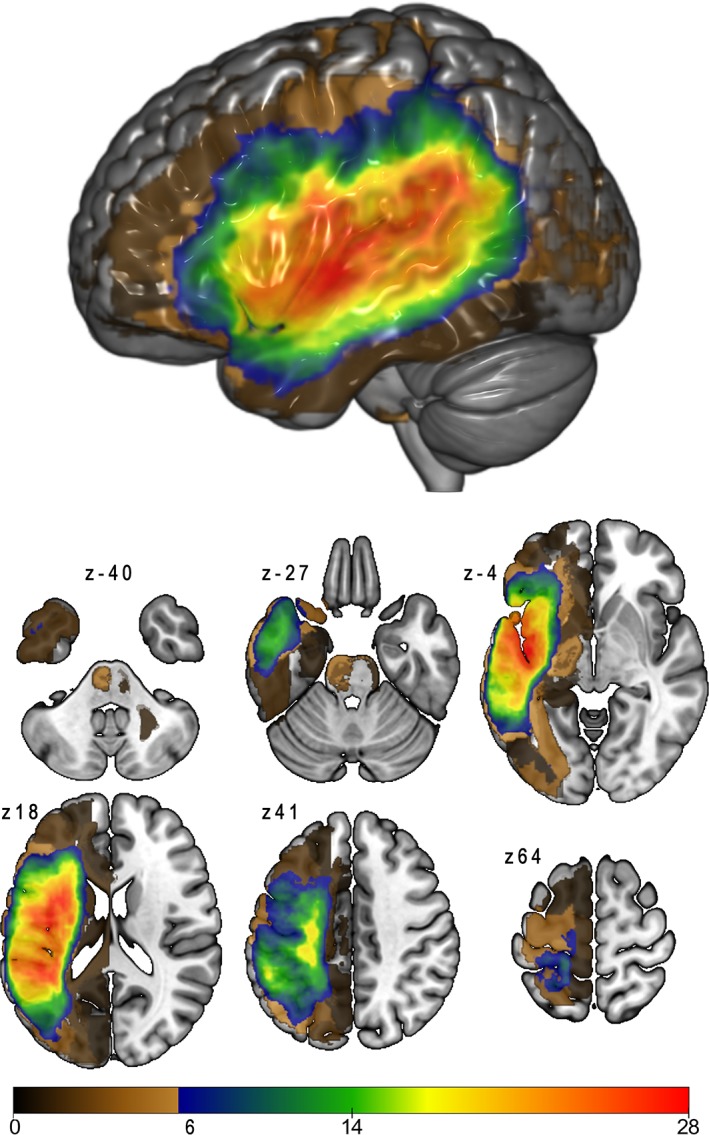
Figure 1.

Lesion overlap map, for the participants included in lesion‐symptom mapping analyses (n = 68). Brown‐shaded areas show lesion overlap for fewer than six participants; these regions were not included in lesion‐symptom mapping analyses [Color figure can be viewed at http://wileyonlinelibrary.com]
