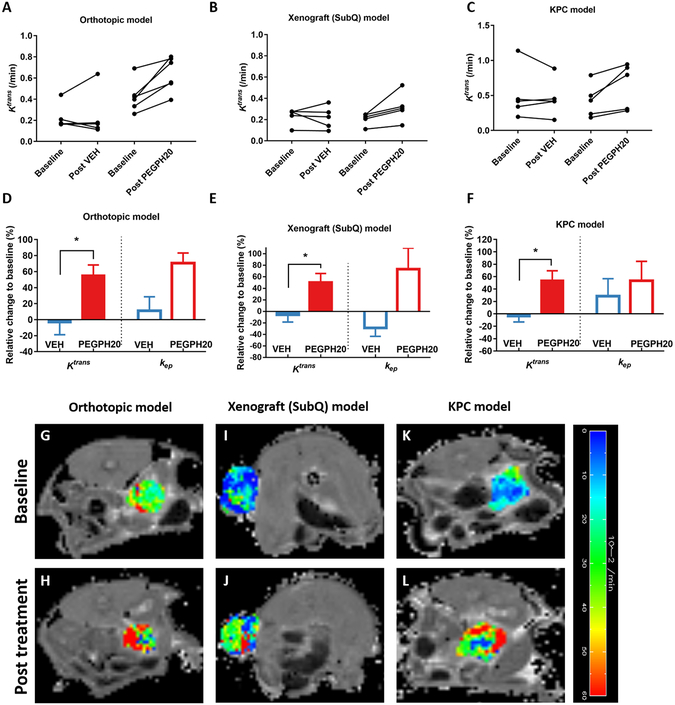
Figure 2. DCE-MRI detects responses to stroma-directed intervention (PEGPH20) in all three PDA models.
Paired Ktrans values from orthotopic model (A) and (B) human xenograft before and after a single injection of PEGPH20 or VEH, as well as from KPC mice at baseline and post-three treatments of PEGPH20 plus gemcitabine (C). Percent changes of Ktrans and kep after the treatment from baseline (D-F). Baseline and post-treatment Ktrans map of the tumor (in color scale) overlaid on the respective T10 map (in grey scale, G-L). *: P< 0.05 compared to VEH group (Mann-Whitney U test).

