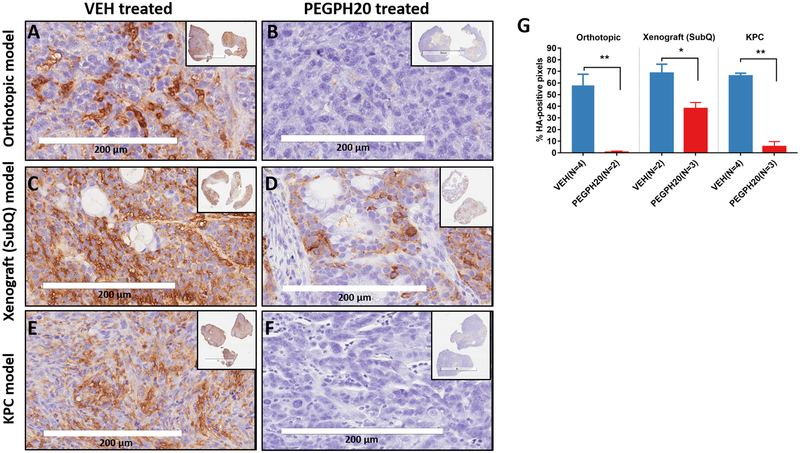
Figure 4. Tumor hyaluronan level and drug delivery efficiency in response to PEGPH20 or VEH treatment.
Representative micrographs of immunostaining for hyaluronan in tumor sections obtained from VEH or PEGPH20 treated KPC model (A, B) orthotopic model (C, D) and xenograft model (E, F). The percentage (mean +/− SD) of hyaluronan-positive pixels in three models after VEH or PEGPH20 treatment (G). *: P< 0.05, **: P<0.005, compared to the respective VEH group. Treatment/imaging schedules are the same as in Fig 1A.

