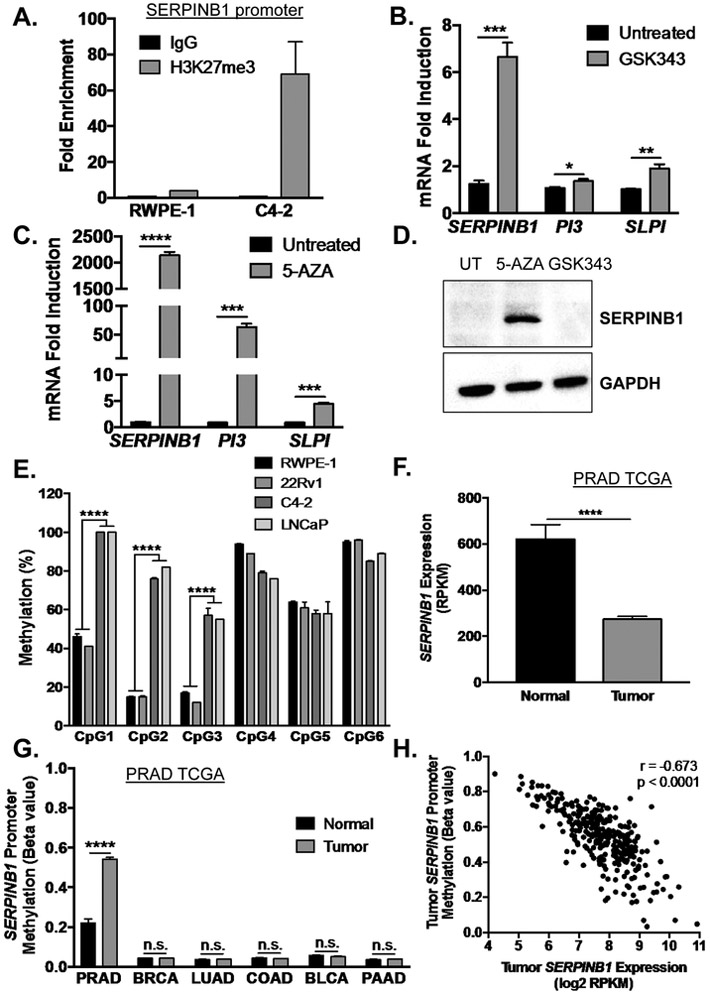
Figure 5. SERPINB1 is epigenetically repressed by EZH2-mediated histone methylation and DNMT-mediated DNA methylation in prostate cancer.
A. Chromatin immunoprecipitation for H3K27me3 on the SERPINB1 promoter was performed in RWPE-1 and C4-2 cells. Data are presented as fold enrichment over IgG controls, and the average of two experiments is shown. B. C4-2 cells were treated with EZH2 inhibitor GSK343 (10 μM) for 72 hours. mRNA expression of SERPINB1, PI3, and SLPI were determined using quantitative PCR and normalized to GAPDH. Data were normalized to untreated samples, and differences were assessed using Student’s t-test (n = 3; * p < 0.05, ** p < 0.01, *** p <0.001). C. C4-2 cells were treated with DNMT inhibitor 5-aza-2-deoxycytidine (5-AZA, 10 μM) for 72 hours. mRNA expression of SERPINB1, PI3, and SLPI were determined using quantitative PCR and normalized to GAPDH. Data were normalized to untreated samples, and differences were assessed using Student’s t-test (n = 3; *** p < 0.001, **** p < 0.0001). D. C4-2 cells were treated with GSK343 and 5-AZA (10 μM) for 72 hours. SERPINB1 expression was determined using Western blot. GAPDH was used as a loading control. A representative blot is shown E. Promoter methylation at six CpG sites in C4-2, LNCaP, 22Rv1, and RWPE-1 cells was measured using pyrosequencing (CpG1 is the island closest to the transcription start site), and differences were determined using Student’s t-test (n = 4, *** p < 0.001). F. SERPINB1 expression in TCGA PRAD was assessed, and difference was determined using Student’s t-test (**** p < 0.0001). G. Analysis for DNA methylation at the SERPINB1 promoter in normal and cancer samples of various malignancies was performed using The Cancer Genome Atlas (TCGA) dataset through the open web interface MethHC (http://methhc.mbc.nctu.edu.tw/php/index.php) [34]. PRAD - prostate adenocarcinoma, BRCA - breast invasive carcinoma, LUAD - lung adenocarcinoma, COAD - colon adenocarcinoma, BLCA – bladder urothelial carcinoma, and PAAD - pancreatic adenocarcinoma. Differences were assessed using Student’s t-test (**** p < 0.0001, n.s. = not significant). H. SERPINB1 methylation versus expression were plotted to examine correlation using two-tailed Pearson correlation analysis (r = −0.673, p < 0.0001).

