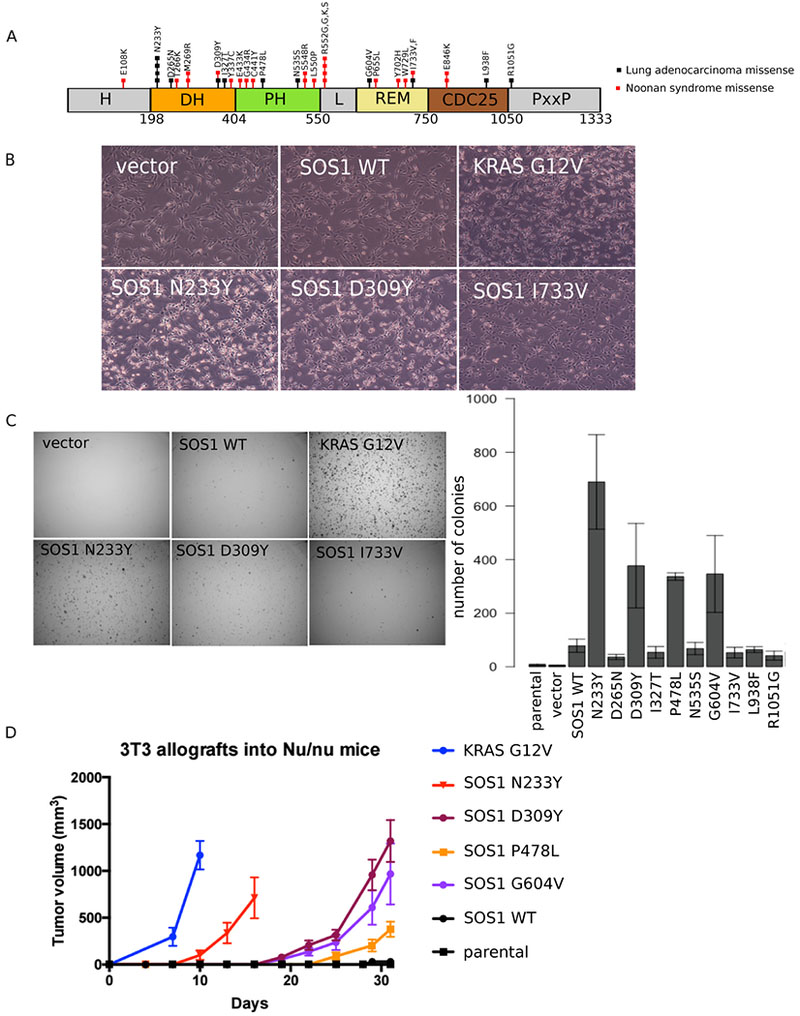
Figure 1: SOS1 mutations drive anchorage-independent growth in vitro and in vivo.

A: SOS1 mutations found in oncogene-negative lung adenocarcinomas and Noonan Syndrome.
B: NIH-3T3 cells expressing different SOS1 mutants were imaged at 40×.
C: NIH-3T3 cells expressing SOS1 mutants were grown in soft agar and imaged after 3 weeks at 6.3×. Colonies were quantified using Cell Profiler. Images are representative of at least three biological replicates, with three technical replicates each. Error bars show SEM from at least three biological replicates. Western blots of SOS1 expression levels across all cells are shown in Figure 2B.
D: NIH-3T3 cells expressing different SOS1 mutants were injected into 4-week old Nu/J female mice. Tumor size was measured every three days using calipers. Tumor volume was calculated as 0.5 × (longer diameter) × (shorter diameter)2. KRAS G12V mutant cells were included as a positive control.
